Bitcoin Price Struggles At $19,000, Bears To Continue Dominating?
Bitcoin price plummeted consistently after it breached the $20,000 mark. Over the last 24 hours, the Bitcoin has registered very little movement. In the past week, BTC lost close to 16% of its value. BTC quickly attempte...
Archive context
Older archive item. Useful for background and entity history, but not a fresh market-moving signal.

Bitcoin price plummeted consistently after it breached the $20,000 mark. Over the last 24 hours, the Bitcoin has registered very little movement.
In the past week, BTC lost close to 16% of its value. BTC quickly attempted to recover from the $19,000 price mark on its chart.
However, the bulls couldn’t defend that price mark. The closest support line for the Bitcoin price was $18,000. Bitcoin has been on a consistent downtrend over the past few months.
The technical outlook of the coin pointed towards increased bearish strength.
Selling pressure continued to exceed buying strength on the one-day chart. The $20,000 price mark will prove to be a strong resistance mark.
$20,000 is the key resistance mark for the Bitcoin price. Increased buying power may provide the coin with some temporary relief.
The global cryptocurrency market cap today is at $962 billion, with a 0.6% positive change in the last 24 hours.
Bitcoin Price Analysis: One Day Chart Bitcoin was priced at $18,800 on the one-day chart | Source: BTCUSD on TradingViewBTC was trading at $18,800 at the time of writing. A few sessions before this, Bitcoin was trading above the $19,000 price mark. The overhead resistance for the coin was at $20,000, which BTC struggled to move past over the past few days.
A sharp decline in buying strength has caused BTC to plunge further and quickly. If BTC moves above the $20,000 price level, the bearish thesis could be invalidated.
On the other hand, lower demand for the asset can even drag Bitcoin price to $17,400. A fall below that price mark could attempt to bring the price of the asset to $14,000.
The amount of Bitcoin traded in the last trading session declined, signalling that sellers took over at the time of writing.
Technical Analysis Bitcoin registered low buying strength on the one day chart | Source: BTCUSD on TradingViewThe fall in buyers caused the Bitcoin price to tumble further. There was a sharp fall in buying strength just a week ago, and ever since, BTC has continued to depreciate on its chart.
The Relative Strength Index was below the half-line, which meant that sellers were numerous as compared to buyers.
The Bitcoin price travelled below the 20-SMA line, displaying a fall in demand. It also meant that sellers were driving the price momentum in the market at the time of writing.
Bitcoin depicted sell signal on the one day chart | Source: BTCUSD on TradingViewOther technical indicators pointed towards a bearish price signal. The Moving Average Convergence Divergence measures the market momentum and overall price direction in the market.
The MACD underwent a bearish crossover and then displayed red histograms, which were sell signal for the coin.
On the other hand, Chaikin Money Flow remained positive with an uptick above the half-line. The indicator determines the amount of capital inflows and outflows.
At the time of writing, CMF displayed increased capital inflows.
Featured image from UnSplash, Chart: TradingView.comWhy this matters
This bitcoin story adds another data point to the current market tape and is useful when read alongside nearby source coverage.
Original source
Read on NewsBTCRelated market context

Ethereum (ETH) Price Prediction: Whale Rotates $155M Into ETH as Longs Surge Near $2,500
Ethereum is trying to stabilize after another volatile stretch, with price returning toward the mid-$2,400 region while several po...
Bitcoin’s Fed Week Starts With A Fresh Rise In US Inflation Expectations
TL;DR: US household inflation expectations rose in October while consumer sentiment barely changed. The readings add context ahead...
Bitcoin ETF Flows Trail Price Moves, DWF Study Finds
Bitcoin ETF flows track recent price moves more closely than subsequent ones, according to DWF Labs research published October 22....
Strategy, Strive face balancing act between bitcoin buying and preferred stock dividends
The securities have financed purchases of nearly 136,000 bitcoin, opening a funding channel that analysts expect to complement the...

Bitcoin Bettors Push Kalshi and Polymarket to a Record $2.7B Week
Crypto contracts on Kalshi and Polymarket hit a record $2.7 billion in weekly volume, driven mostly by short-term bets on where bi...
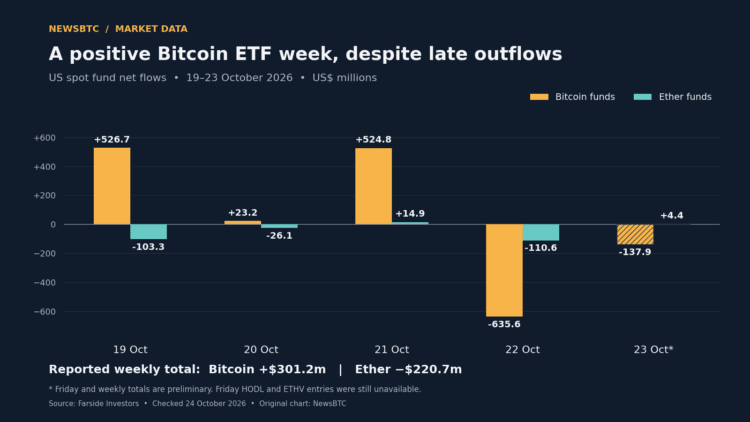
Bitcoin ETF Week Stays Positive After Nearly $774 Million In Late Outflows
TL;DR: Farside’s preliminary figures show US Bitcoin funds retaining a $301.2 million weekly inflow despite two days of withdrawal...