Bitcoin Price Struggles Below $48K, Why BTC Could Correct Lower
Bitcoin price started another increase above the $46,500 resistance. BTC cleared the $47,800 resistance and spiked toward $48,000 before the bears appeared. Bitcoin topped near the $49,000 level and corrected gains. The...
Archive context
Older archive item. Useful for background and entity history, but not a fresh market-moving signal.

Bitcoin price started another increase above the $46,500 resistance. BTC cleared the $47,800 resistance and spiked toward $48,000 before the bears appeared.
- Bitcoin topped near the $49,000 level and corrected gains.
- The price is trading above $45,500 and the 100 hourly Simple moving average.
- There is a key bullish trend line forming with support near $45,900 on the hourly chart of the BTC/USD pair (data feed from Kraken).
- The pair could start a fresh decline if there is a move below the $45,600 support zone.
Bitcoin price attempted a fresh increase above the $46,800 and $47,200 levels. BTC even cleared the $48,000 resistance and spiked toward $49,000. A new multi-week high was formed near $49,000 before the price trimmed all gains.
There was a sharp move below the $47,500 and $47,000 levels. The price even retested the $45,500 support zone. A low was formed near $45,619 and the price is now consolidating losses.
Bitcoin is trading above $45,500 and the 100 hourly Simple moving average. There is also a key bullish trend line forming with support near $45,900 on the hourly chart of the BTC/USD pair. On the upside, immediate resistance is near the $46,400 level and the 23.6% Fib retracement level of the downward move from the $49,000 swing high to the $45,619 low.
The first major resistance is $47,300 or the 50% Fib retracement level of the downward move from the $49,000 swing high to the $45,619 low. A clear move above the $47,300 resistance could send the price toward the $48,200 resistance.
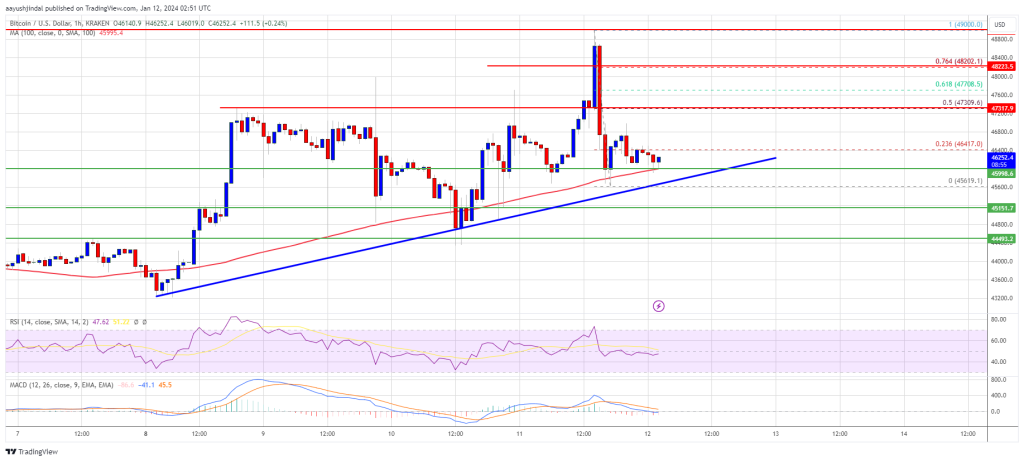
Source: BTCUSD on TradingView.com
The next resistance is now forming near the $49,000 level. A close above the $49,000 level could send the price further higher. The next major resistance sits at $50,000.
More Losses In BTC?If Bitcoin fails to rise above the $47,300 resistance zone, it could start a fresh decline. Immediate support on the downside is near the $45,900 level and the trend line.
The next major support is $45,500. If there is a move below $45,500, the price could gain bearish momentum. In the stated case, the price could drop toward the $44,450 support in the near term.
Technical indicators:
Hourly MACD – The MACD is now losing pace in the bullish zone.
Hourly RSI (Relative Strength Index) – The RSI for BTC/USD is now below the 50 level.
Major Support Levels – $45,900, followed by $45,500.
Major Resistance Levels – $47,300, $48,200, and $49,000.
Why this matters
This bitcoin story adds another data point to the current market tape and is useful when read alongside nearby source coverage.
Original source
Read on NewsBTCRelated market context

Ethereum (ETH) Price Prediction: ETH Holds Near $2,500 as ETF Flows Turn Positive and Long Positions Reach Four-Year High
Ethereum is holding close to $2,500 after a volatile start to October, with the market now showing a mixture of improving institut...

Ethereum Price Prediction: Tom Lee Warns of ETH Drawdown After Kospi Bloodbath
Ethereum is trading at the $2,500 level as Tom Lee warns that Korea’s equity rout could spill into crypto, a bearish price predict...

Bitcoin (BTC) Price Prediction: Slowing Whale Selling Offers Hope as $81.5K ETF Support Holds
On-chain data indicates that distribution from longer-term holders has slowed, offering some relief to the market. However, weaken...

Hyperliquid (HYPE) Price Today: HYPE Holds $80 Support Despite Mounting Bearish Pressure
CoinGecko data puts Hyperliquid’s market capitalization at approximately $18.04 billion and its daily trading volume near $918 mil...

Binance News: Miners Must Move Before Pool Closes on November 10
In Binance news today, the exchange will shut down Binance Pool and related services at 07:00 UTC on November 10, 2026, ending its...

Ethereum Name Service plans major .eth overhaul with one irreversible catch for domain holders
Ethereum Name Service has proposed activating ENSv2 without requiring existing .eth domain holders to migrate to the new system. T...