Bitcoin Price Stuck In Crucial Range, 2023 Breakout Looms
Bitcoin price is still trading in a range below the $17,000 resistance. BTC could witness a major breakout as we approach the New Year 2023. Bitcoin failed to clear the $17,000 and $17,200 resistance levels. The price is...
Archive context
Older archive item. Useful for background and entity history, but not a fresh market-moving signal.

Bitcoin price is still trading in a range below the $17,000 resistance. BTC could witness a major breakout as we approach the New Year 2023.
- Bitcoin failed to clear the $17,000 and $17,200 resistance levels.
- The price is trading below $16,800 and the 100 hourly simple moving average.
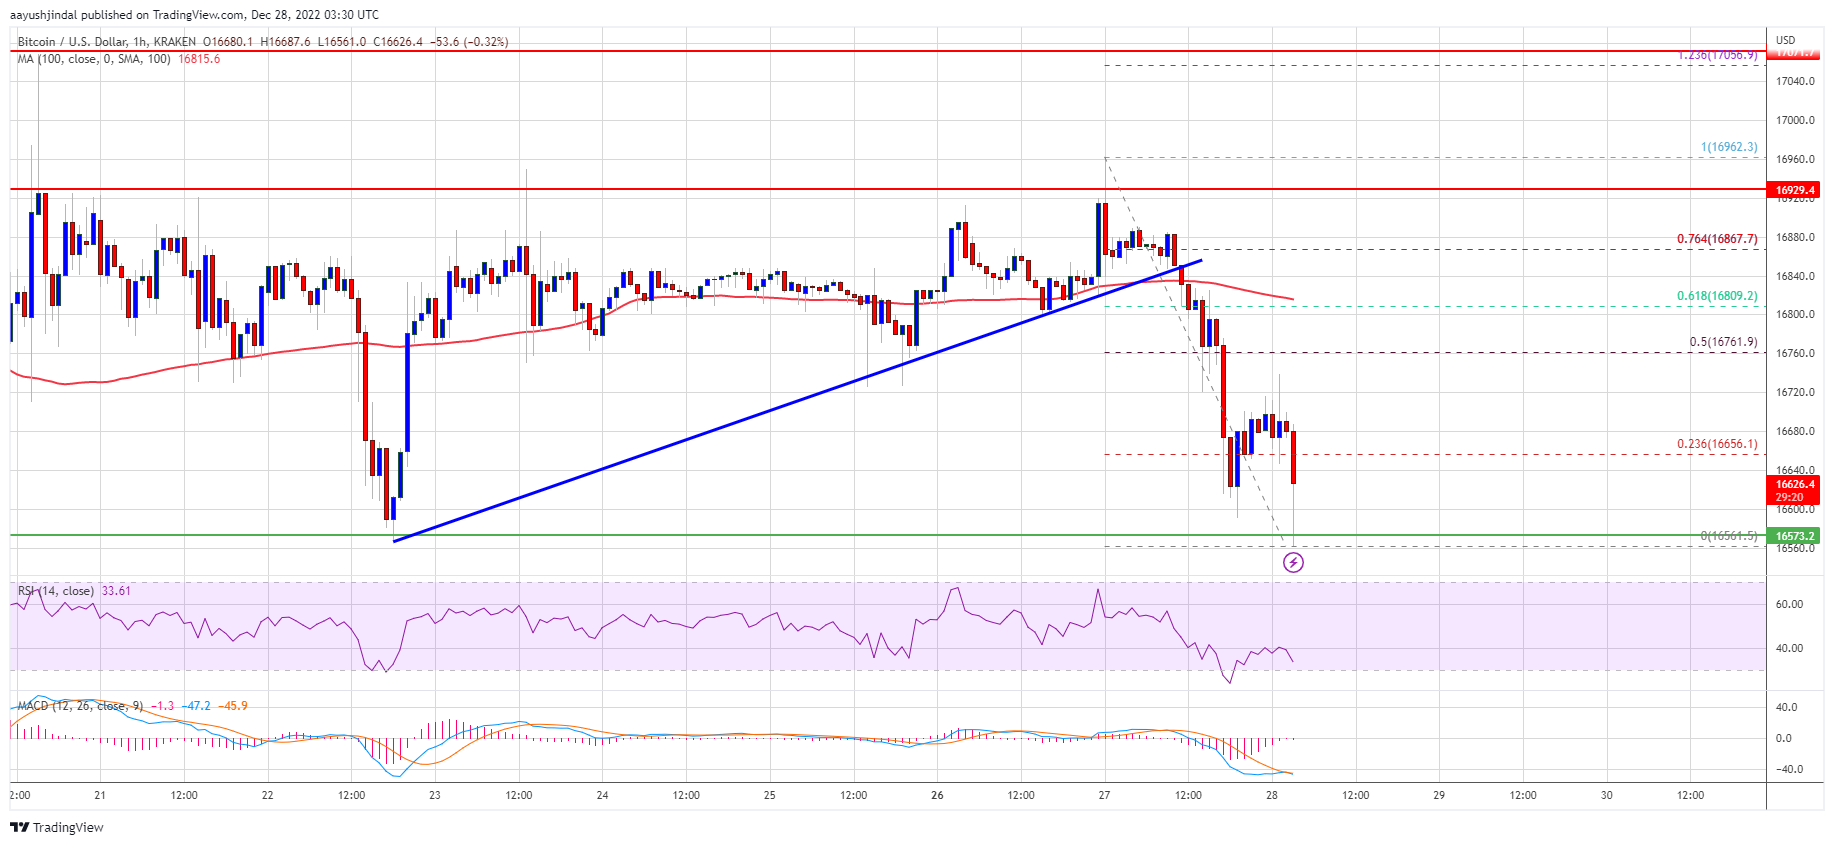
- There was a break below a major bullish trend line with support near $16,840 on the hourly chart of the BTC/USD pair (data feed from Kraken).
- The pair could decline further if there is a clear move below the $16,550 support zone.
Bitcoin price made another attempt to clear the $17,000 resistance zone. However, BTC struggled to gain pace for a clear move above the $17,000 level.
A high was formed near $16,962 before the price started a fresh decline. There was a clear move below the $16,800 support zone and the 100 hourly simple moving average. Besides, there was a break below a major bullish trend line with support near $16,840 on the hourly chart of the BTC/USD pair.
Bitcoin price tested the key $16,550 support zone. A low is formed near $16,561 and the price is now consolidating losses. It tested the 23.6% Fib retracement level of the downward move from the $16,962 swing high to $16,561 low.
On the upside, an immediate resistance is near the $16,720 zone. The first major resistance is near the $16,800 zone and the 100 hourly SMA. It is close to the 61.8% Fib retracement level of the downward move from the $16,962 swing high to $16,561 low.
Source: BTCUSD on TradingView.com
The main barrier is still near the $17,000 level. A clear move above the $17,000 resistance might start a steady recovery wave. The next major resistance is near $17,200, above which the price rise towards the $17,500 resistance zone. Any more gains might spark a move towards the $18,000 resistance zone.
More Losses in BTC?If bitcoin fails to clear the $16,800 resistance, it could continue to move down. An immediate support on the downside is near the $16,550 level.
The next major support is near the $16,350 level. A downside break below the $16,350 support might send the pair towards the $16,000 level. Any more losses might send the price towards $15,550.
Technical indicators:
Hourly MACD – The MACD is now losing pace in the bearish zone.
Hourly RSI (Relative Strength Index) – The RSI for BTC/USD is now below the 50 level.
Major Support Levels – $16,550, followed by $16,350.
Major Resistance Levels – $16,800, $17,000 and $17,200.
Why this matters
This bitcoin story adds another data point to the current market tape and is useful when read alongside nearby source coverage.
Original source
Read on NewsBTCRelated market context

Ethereum Price Prediction: Robinhood Chain Leads Ethereum’s Biggest User Onboarding Wave
Price prediction debates are heating up as Ethereum trades at $1,790 and is slipping in trading volume. Still, Robinhood Chain kee...

Ethereum (ETH) Price Prediction: ETH Eyes $2,100 as ETF Inflows Return and Whale Demand Builds
Ethereum price is trading near $1,785 after a modest 24-hour recovery, but the market is now watching whether fresh inflows and wh...

XRP’s $1 rebound faces holders trapped above $2
Glassnode reported that XRP holders who bought between 6 and 12 months ago have an average cost basis near $2.22, roughly 52% abov...

XRP Price Prediction: Key Metrics Point to a Crash
XRP prediction chatter is heating up even as the price slips, which is usually when markets like to play tricks. XRP trades at aro...

Bitcoin Price Prediction: Strategy Has a New BTC Approach
Bitcoin price is trading at $62,900, as we debate whether this pause is simply a reset or something more serious, with bearish pre...

Crypto News, July 14: Telegram Registry Down, Bitcoin and Ethereum Price Eye Iran War Resolution
Telegram users woke up to broken t.me links after the platform’s short domain became unreachable, disrupting invites, public chann...