Bitcoin Price Takes a Plunge: Analyzing the Sudden Drop
Bitcoin price started another decline after it struggled near $64,550. BTC declined below the $63,500 support and might continue to move down. Bitcoin started a fresh decline from the $64,550 resistance level. The price...
Archive context
Older archive item. Useful for background and entity history, but not a fresh market-moving signal.

Bitcoin price started another decline after it struggled near $64,550. BTC declined below the $63,500 support and might continue to move down.
- Bitcoin started a fresh decline from the $64,550 resistance level.
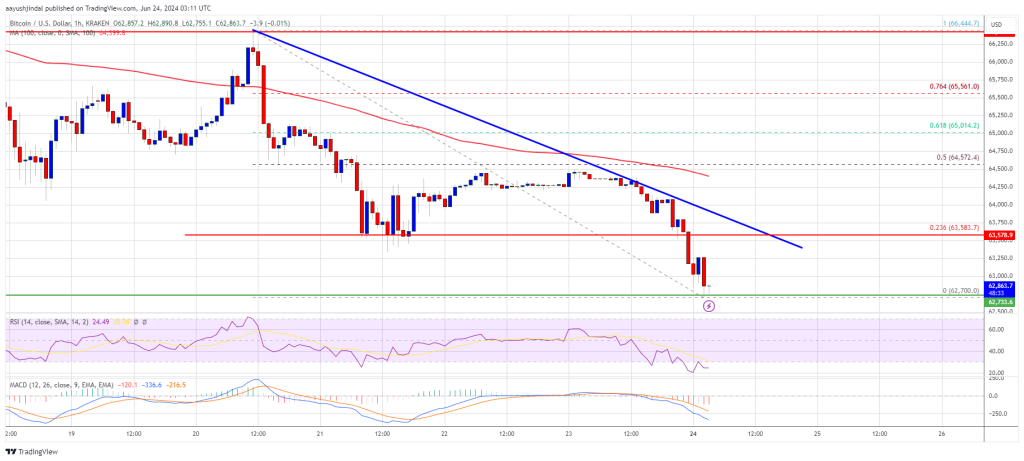
- The price is trading below $63,500 and the 100 hourly Simple moving average.
- There is a connecting bearish trend line forming with resistance at $63,600 on the hourly chart of the BTC/USD pair (data feed from Kraken).
- The pair could extend losses if there is a clear move below the $62,700 and $62,500 support levels.
Bitcoin price failed to recover above the $65,000 level. BTC struggled near $64,550 and started another decline. There was a steady decline below the $64,000 and $63,500 levels.
The price even declined below the $63,000 level. A low was formed at $62,700 and the price is now consolidating losses. There is also a connecting bearish trend line forming with resistance at $63,600 on the hourly chart of the BTC/USD pair.
Bitcoin is now trading below $63,500 and the 100 hourly Simple moving average. If there is a recovery wave, the price could face resistance near the $63,550 level and the 23.6% Fib retracement level of the downward move from the $66,444 swing high to the $62,700 low.
The first major resistance could be $64,000. The next key resistance could be $64,500 or the 50% Fib retracement level of the downward move from the $66,444 swing high to the $62,700 low.
A clear move above the $64,500 resistance might start a steady increase and send the price higher. In the stated case, the price could rise and test the $65,500 resistance. Any more gains might send BTC toward the $66,200 resistance in the near term.
More Downsides In BTC?If Bitcoin fails to climb above the $63,550 resistance zone, it could continue to move down. Immediate support on the downside is near the $62,700 level.
The first major support is $62,200. The next support is now forming near $62,000. Any more losses might send the price toward the $61,200 support zone in the near term.
Technical indicators:
Hourly MACD – The MACD is now gaining pace in the bearish zone.
Hourly RSI (Relative Strength Index) – The RSI for BTC/USD is now below the 50 level.
Major Support Levels – $62,700, followed by $62,200.
Major Resistance Levels – $63,550, and $64,500.
Why this matters
This bitcoin story adds another data point to the current market tape and is useful when read alongside nearby source coverage.
Original source
Read on NewsBTCRelated market context

Bitcoin (BTC) Price Prediction: BTC Holds $63K Support—Can Rising Active Addresses Offset Bearish Technical Signals?
Although the BTC price has remained near a key support zone, recent chart signals and Strategy’s sale of a portion of its Bitcoin...

IPO volume hits levels last seen in 1929 and 2000, and crypto markets are building the on-ramp
The surge in IPOs and crypto's role in facilitating access could signal heightened market volatility and regulatory challenges ahe...

Bitcoin price rebounds to $63K as leverage returns creating short term volatility risk
Bitcoin's rebound has cleared the first test: price recovered. The harder one starts now: proving buyers remain after the squeeze....

Sui DeFi TVL Breaks $1 Billion As Move-Based Chains Fight For Liquidity
Sui has crossed the $1 billion total value locked mark on DeFiLlama, giving the Move-based network a clearer claim to serious DeFi...

USDT Returns to Bitcoin: RGB and UTEXO Enable Private Lightning Settlements
Bitcoin Magazine USDT Returns to Bitcoin: RGB and UTEXO Enable Private Lightning Settlements Tether, the company behind USDT, is p...

Bitcoin miner bottom signal now depends on who survives weak mining profits
A Bitcoin miner-stress signal circulating on X has fallen into a zone analysts associate with severe miner pressure, putting a fam...