Bitcoin Price Topside Bias Vulnerable Unless It Surges Past $27,500
Bitcoin price is struggling below $27,500. BTC is now at risk of a downside break unless there is a close above the $27,500 resistance. Bitcoin started another decline and traded below the $26,800 level. The price is tra...
Archive context
Older archive item. Useful for background and entity history, but not a fresh market-moving signal.

Bitcoin price is struggling below $27,500. BTC is now at risk of a downside break unless there is a close above the $27,500 resistance.
- Bitcoin started another decline and traded below the $26,800 level.
- The price is trading below $27,200 and the 100 hourly Simple moving average.
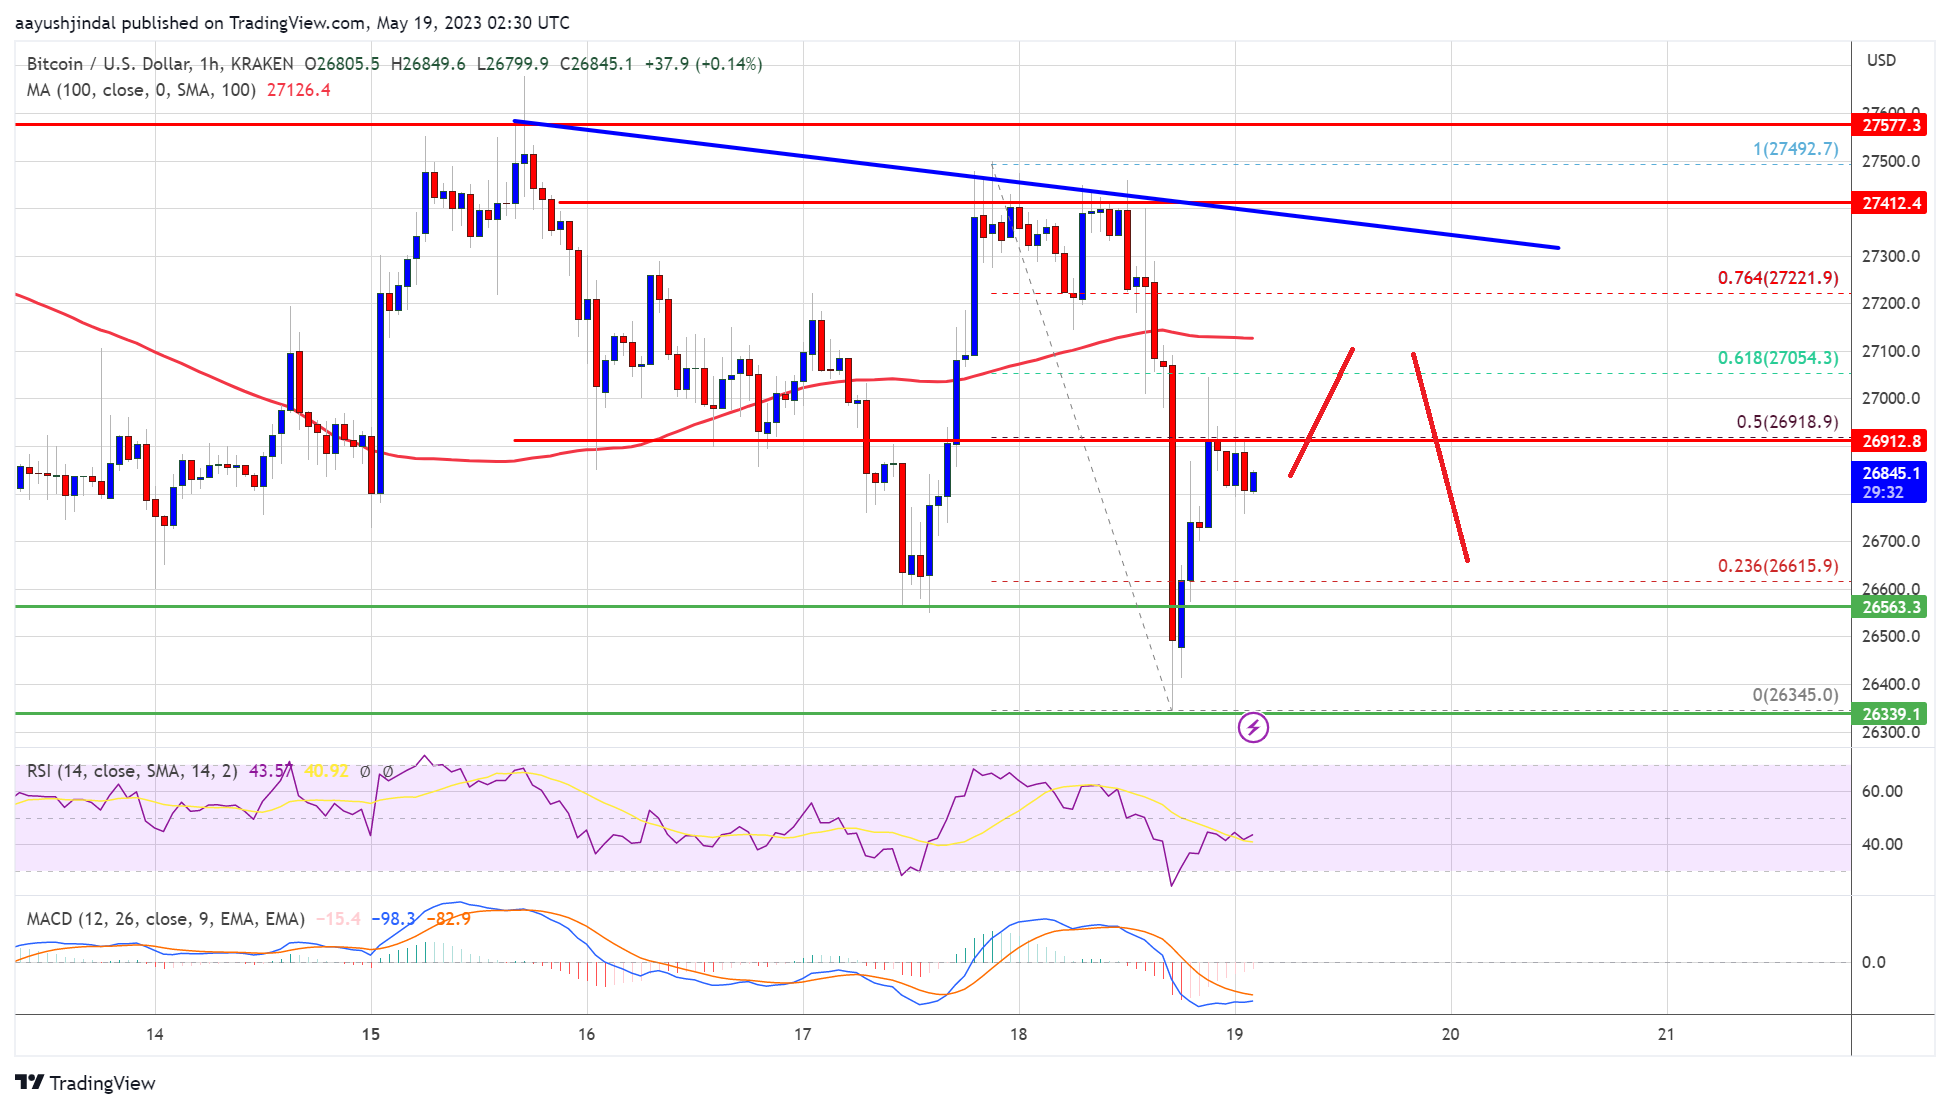
- There is a key bearish trend line forming with resistance near $27,320 on the hourly chart of the BTC/USD pair (data feed from Kraken).
- The pair could start a fresh rally if it clears the $27,320 and $27,500 resistance levels.
Bitcoin price started a fresh decline below the $27,200 level. BTC even traded below the $26,550 support zone to set a new weekly low.
A low is formed near $26,345 and the price is now attempting a fresh increase. There was a move above the 23.6% Fib retracement level of the recent decline from the $27,492 swing high to the $26,345 low. It is now trading below $27,200 and the 100 hourly Simple moving average.
There is also a key bearish trend line forming with resistance near $27,320 on the hourly chart of the BTC/USD pair. Bitcoin price is now struggling to clear the $27,000 resistance.
It is facing barriers near the 50% Fib retracement level of the recent decline from the $27,492 swing high to the $26,345 low. The next major resistance is near the $27,320 level and the trend line. A close above the $27,320 resistance might reduce selling pressure.
Source: BTCUSD on TradingView.com
The next key resistance is near $27,550, above which the price might gain bullish momentum and test the $28,000 resistance. Any more gains might send the price toward the $28,500 level.
Fresh Decline in BTC?If Bitcoin’s price fails to clear the $27,320 resistance, it could start a fresh decline. Immediate support on the downside is near the $26,550 level.
The next major support is near the $26,350 zone, below which the price might gain bearish momentum. In the stated case, it could test the $26,000 level. Any more losses might take Bitcoin toward the $25,500 level in the near term.
Technical indicators:
Hourly MACD – The MACD is now losing pace in the bearish zone.
Hourly RSI (Relative Strength Index) – The RSI for BTC/USD is now below the 50 level.
Major Support Levels – $26,550, followed by $26,350.
Major Resistance Levels – $27,000, $27,320, and $27,500.
Why this matters
This bitcoin story adds another data point to the current market tape and is useful when read alongside nearby source coverage.
Original source
Read on NewsBTCRelated market context

Avalanche (AVAX) Price Prediction: AVAX Slips Near $6.71 as ETF Removal, Bearish Patterns, and $6.50 Support Put Bulls Under Pressure
AVAX price is trading near $6.71 after falling around 1% over the past 24 hours, based on Brave New Coin data. The move keeps AVAX...

Hyperliquid (HYPE) Price Prediction: HYPE Holds Above 200 EMA as Fair Value Gap Retest Fuels $92 Outlook
While the Hyperliquid price pulled back from recent highs near $76–$77, several market observers argue that the retracement remain...

Ethereum (ETH) Price Prediction: ETH Slips Towards $1,746 as Bulls Eye $1,800 Breakout and OBV Confirmation
Ethereum is currently trading around $1,746 following a mild pullback over the past 24 hours. The asset has slipped roughly 1.56%...
XRP Price Prediction: Can XRP Crack $1.20 Before Clarity Act?
XRP price prediction remains centered on one question: can buyers finally push through the $1.15 to $1.20 resistance range? For no...

Bitcoin’s $10 billion credit market keeps growing after its first major selloff
Bitcoin’s more than $10 billion corporate credit market is still attracting new entrants after a June selloff triggered margin cal...

Elon Musk Grok AI Predicts XRP Will Explode by End of 2026
Elon Musk Grok AI just cataloged every major institutional development in the XRP ecosystem and arrived at one of the cleaner year...