Bitcoin Price Trend Overwhelmingly Negative, Bears Target $13K
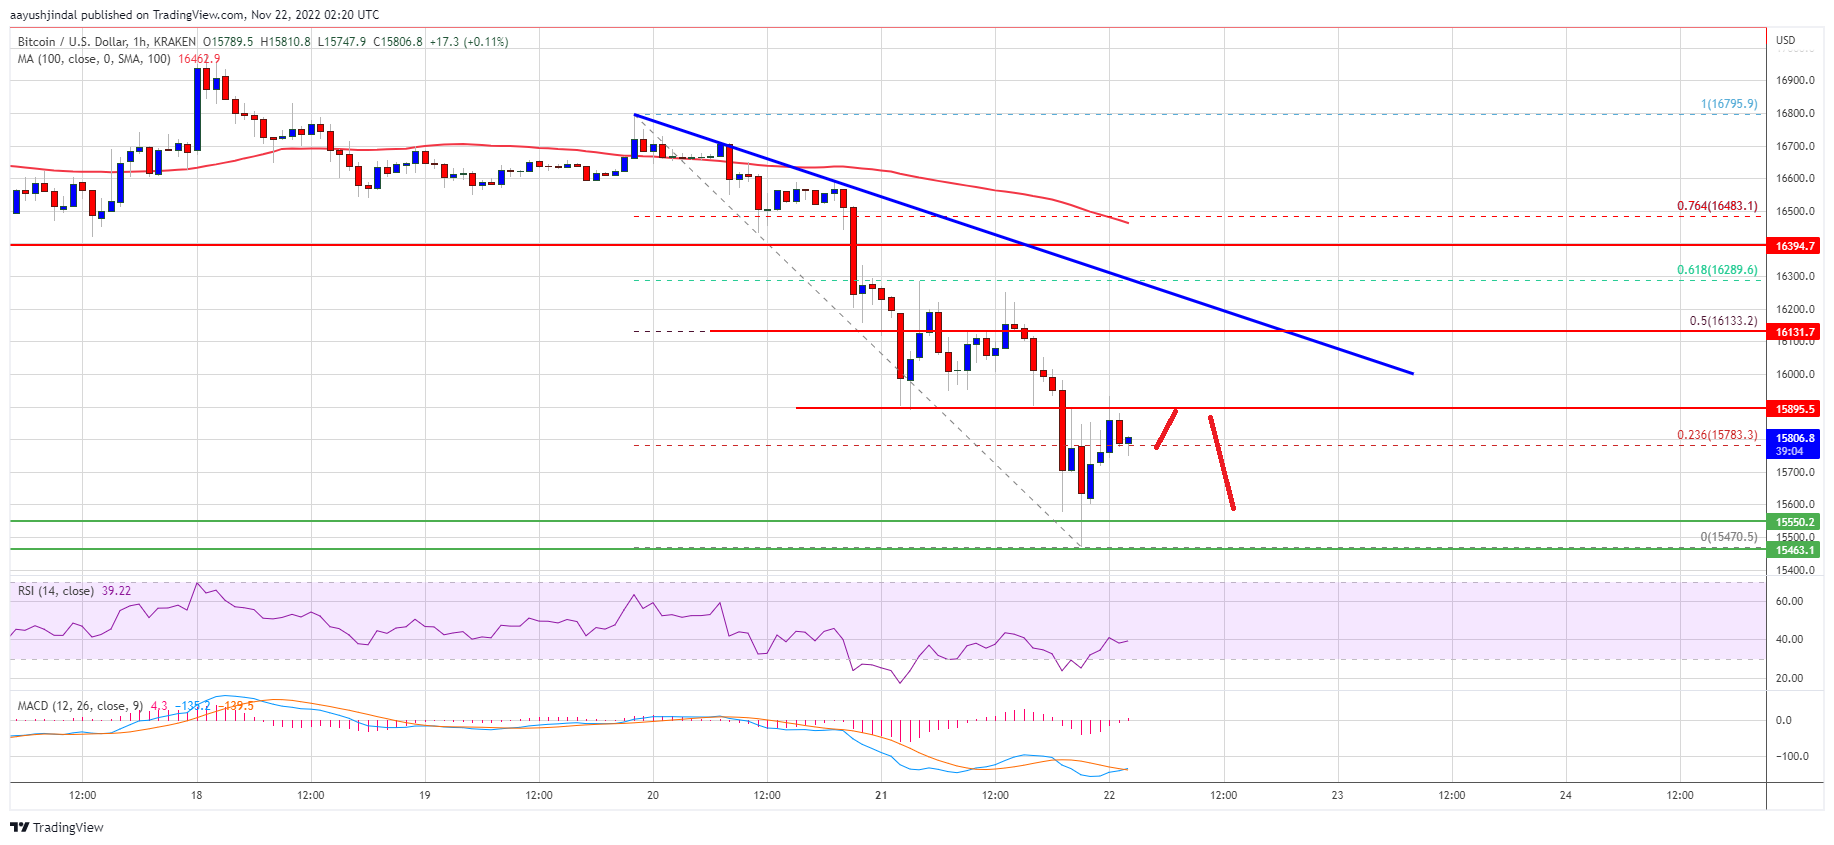
Bitcoin price extended losses and retested the $15,800 support. BTC could continue to move down towards the $15,000 and $14,000 levels. Bitcoin started a fresh decline below the $16,000 and $15,800 levels. The price is t...
Archive context
Older archive item. Useful for background and entity history, but not a fresh market-moving signal.

Bitcoin price extended losses and retested the $15,800 support. BTC could continue to move down towards the $15,000 and $14,000 levels.
- Bitcoin started a fresh decline below the $16,000 and $15,800 levels.
- The price is trading below $16,400 and the 100 hourly simple moving average.
- There is a major bearish trend line forming with resistance near $16,150 on the hourly chart of the BTC/USD pair (data feed from Kraken).
- The pair remains at a risk of more losses towards the $15,000 level or even $14,000.
Bitcoin price started a fresh decline from the $17,000 resistance. BTC gained bearish momentum after it settled below the $16,500 support zone.
There was a move below the $16,000 level and the 100 hourly simple moving average. The bears were able to push the price towards the key $15,500 support zone. A low is formed near $15,470 and the price is now correcting losses.
There was a minor increase above the $15,800 resistance zone. Bitcoin price cleared the 23.6% Fib retracement level of the recent drop from the $16,795 swing high to $15,470 low.
On the upside, an immediate resistance is near the $15,880 level. The first major resistance is near the $16,150 zone. There is also a major bearish trend line forming with resistance near $16,150 on the hourly chart of the BTC/USD pair.
Source: BTCUSD on TradingView.com
The 50% Fib retracement level of the recent drop from the $16,795 swing high to $15,470 low. The next major resistance is near the $16,400 level. The price must clear the trend line resistance and then $16,400 to start a decent increase. The next major resistance is near $16,500, above which the price could gain pace for a move towards the $17,000 zone.
More Losses in BTC?If bitcoin fails to recover above the $16,150 resistance zone, it could continue to move down. An immediate support on the downside is near the $15,650 level.
The next major support is near the $15,500 zone, below which the price might test the key support at $15,000. A clear move below the $15,000 support might send the price further lower, may be towards $13,200.
Technical indicators:
Hourly MACD – The MACD is now losing pace in the bearish zone.
Hourly RSI (Relative Strength Index) – The RSI for BTC/USD is now below the 50 level.
Major Support Levels – $15,650, followed by $15,500.
Major Resistance Levels – $16,150, $16,400 and $16,500.
Why this matters
This bitcoin story adds another data point to the current market tape and is useful when read alongside nearby source coverage.
Original source
Read on NewsBTCRelated market context

Ethereum Research Thread Puts Sybil Resistance Back In Focus For Decentralized Networks
Ethereum Research Thread Puts Sybil Resistance Back In Focus For Decentralized Networks is a useful reminder that crypto coverage...

XRP Price Prediction: Key Metrics Point to a Crash
XRP prediction chatter is heating up even as the price slips, which is usually when markets like to play tricks. XRP trades at aro...

Ripple Crowned: UK Treasury Just Changed Everything for XRP
In the latest XRP news, Ripple Labs has joined the UK HM Treasury’s Wholesale Digital Markets taskforce, a 54-firm initiative that...

Ethereum Price Prediction: Robinhood Chain Leads Ethereum’s Biggest User Onboarding Wave
Price prediction debates are heating up as Ethereum trades at $1,790 and is slipping in trading volume. Still, Robinhood Chain kee...

Bitcoin pushes toward $65,000 on US inflation relief that may already be fading
Bitcoin approached $65,000 on July 14 as a sharper-than-expected slowdown in US inflation weakened the case for another near-term...

Chainalysis Adds Automatic Stablecoin Support As Compliance Teams Face Token Sprawl
Chainalysis Adds Automatic Stablecoin Support As Compliance Teams Face Token Sprawl is a useful reminder that crypto coverage is n...