Bitcoin Realized Market Cap Breaks $400 Billion All-Time High
Bitcoin's realized market capitalization, a measure of the average cost basis for all bitcoin on the network, has broken its all-time high and hit $400 billion.The below is from a recent edition of the Deep Dive, Bitcoin...
Archive context
Older archive item. Useful for background and entity history, but not a fresh market-moving signal.
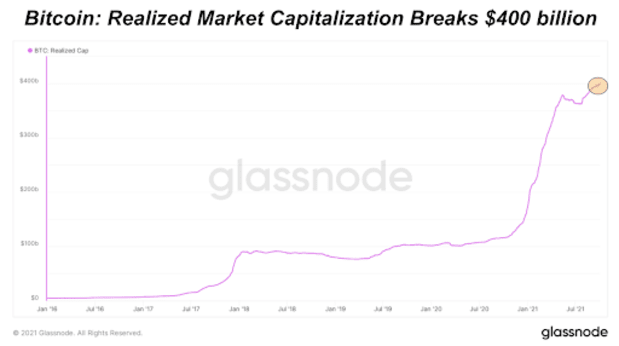
Bitcoin's realized market capitalization, a measure of the average cost basis for all bitcoin on the network, has broken its all-time high and hit $400 billion.
The below is from a recent edition of the Deep Dive, Bitcoin Magazine's premium markets newsletter. To be among the first to receive these insights and other on-chain bitcoin market analysis straight to your inbox, subscribe now.
The realized market capitalization of bitcoin just broke another all-time high and surpassed $400 billion. Realized price and market capitalization is an on-chain trend we follow extremely closely in The Deep Dive, as the realized price is essentially the average cost basis for all bitcoin on the network.
With the realized market capitalization breaking $400 billion, the bitcoin realized price is at $21,250.
Source: GlassnodeSource: Glassnode
When analyzing the history of the bitcoin realized price, we can identify clear trends that identify the underlying market trends. First covered by The Deep Dive in July in The Daily Dive #022, realized price gives a very transparent view of the status of the bitcoin market cycle. When realized price is appreciating rapidly, it means that bitcoin is in a bull market (green). This occurs as a new wave of entrants enter the market and attempt to secure their share of the network, which places a large bid in the market.
At the same time, with price going parabolic (due to the fundamental supply/demand imbalance) old holders take some chips off the table and the dynamic of coins switching hands leads to a rapid appreciation of realized price/cap.
Conversely, during bear markets (red), the realized price trends downwards as coins are spent at a loss (compared to when they were originally acquired). It is important to note, however, that the realized price falls far less proportionally compared to the market price/market capitalization, which was subject to the reflexive phase of the bull market.
Lastly, during the accumulation phase (yellow) of the market cycle, you will see realized price stay stagnant or rise slightly as coins are transferred from weak hands to strong hands, from speculators to convicted HODLers.
Although some may argue that we have been in one constant bull market since the halving in May 2020, when looking at realized price trends we observe a bull market from October 2020 to May 2021, a brief two month bear market and now a reaccumulation phase before the next parabolic bull trend.
Source: GlassnodeSome may argue that the recent upwards trend reflects that bitcoin is structurally in a bull market, however, it is important to note the slope of the uptrend in logarithmic scale is the true reflection of a bitcoin bull run. When viewed in linear scale (the chart above) for perspective, it may look like a bull market, but in logarithmic terms with a multiple cycle view it is clear that we are in the accumulation phase, coiling up for the next parabolic bull market move. The arrows below display the slope of realized price during each market phase.
Source: GlassnodeWhy this matters
This bitcoin story adds another data point to the current market tape and is useful when read alongside nearby source coverage.
Original source
Read on Bitcoin MagazineRelated market context

Chinese national extradited to US over alleged Cambodian crypto scam network
The extradition highlights the global crackdown on crypto scams, emphasizing the need for international cooperation to combat fina...

Kalshi and Polymarket hit record $2.7 billion in weekly crypto volume
The surge in crypto prediction market volume highlights a shift towards short-term speculative trading, impacting traditional trad...

NY Seeks $1.37 Billion Judgment Against Operators of NovaTech Crypto Ponzi Scheme
Bitcoin Magazine NY Seeks $1.37 Billion Judgment Against Operators of NovaTech Crypto Ponzi Scheme New York Attorney General Letit...

Ether ETFs Are Having Their Worst Month of 2026. Who Buys Once Bitmine Stops?
Ether’s (ETH) demand this year has largely come from two places: spot exchange-traded funds (ETFs) and Bitmine Immersion Technolog...

Tokenized assets pull in more than $1 billion in fresh capital in 30 days
The surge in tokenized asset investments highlights growing interest in digital finance, but reliance on key players and measureme...

CME Group posts record $469.5 billion in crypto derivatives volume in Q3
CME's record crypto derivatives volume highlights growing institutional interest and potential for increased market stability and...