Bitcoin rebounds as traders spot China ‘weaker yuan’ chart, but US trade war caps $80K BTC rally
Bitcoin (BTC) danced around $80,000 at the April 8 Wall Street open as US stock markets staged a fresh recovery, but unresolved tensions between China and the US continue to put a damper on BTC’s upside. BTC/USD 1-hour c...
Archive context
Older archive item. Useful for background and entity history, but not a fresh market-moving signal.

Bitcoin (BTC) danced around $80,000 at the April 8 Wall Street open as US stock markets staged a fresh recovery, but unresolved tensions between China and the US continue to put a damper on BTC’s upside.
BTC/USD 1-hour chart. Source: Cointelegraph/TradingView
Hayes: Bitcoin can repeat historic China inflowsData from Cointelegraph Markets Pro and TradingView showed BTC price volatility cooling while the S&P 500 and Nasdaq Composite Index gained up to 4.3% in the first few hours of trading.
Stocks built on a strong rebound that had accompanied the start of the week’s TradFi trading, alleviating fears of a 1987 “Black Monday” style crash.
US trade tariffs nonetheless stayed top of the agenda for traders, who in particular eyed the ongoing war of words with China.
In a post on Truth Social, US President Donald Trump claimed that Beijing “wants to make a deal, badly, but they don't know how to get it started.”
“We are waiting for their call,” he told readers.
Source: Truth Social
Bitcoin advocates eyed the devaluation of the yuan as part of China’s tariff response and the potential inflows to hedges such as BTC as a result.
“Xi's major weapon is independent monetary policy which necessitates a weaker yuan,” Arthur Hayes, ex-CEO of crypto exchange BitMEX, wrote in part of X coverage of the topic.
Hayes suggested that either the People’s Bank of China (PBoC) or the US Federal Reserve would ultimately provide the fuel for a BTC price rally.
“If not the Fed then the PBOC will give us the yachtzee ingredients,” he argued in his characteristic style.
“CNY deval = narrative that Chinese capital flight will flow into $BTC. It worked in 2013 , 2015, and can work in 2025. Ignore China at your own peril.”USD/CNY 3-day chart. Source: Cointelelgraph/TradingView
The Fed, meanwhile, could boost Bitcoin and risk assets by lowering interest rates to stimulate growth. In a blog post on the day, AllianceBernstein predicted this happening even as tariffs added to inflationary pressures.
“If the economy slows, as we expect it will, the Fed will be inclined to cut rates even if price levels are high,” Eric Winograd, the firm’s Developed Market Economic Research director wrote.
“The view is that actual inflation tells us what the economy was doing but not what it will do. The Fed has cut rates before with inflation elevated, and we expect it to do so again unless—a very big ‘unless’—inflation expectations become unanchored.”Fed target rate probabilities (screenshot). Source: CME Group
Winograd said that AllianceBernstein expected 75 basis points of rate cuts in 2025, with the latest data from CME Group’s FedWatch Tool showing markets betting on the first of these coming at the Fed’s June meeting.
Related: $2T fake tariff news pump shows ‘market is ready to ape’
Fibonacci offers a “big level to watch” for BTC priceConsidering the global market tumult of the last three days, Bitcoin’s price action has remained eerily cool on the shorter timeframes as snap price moves gave way to consolidation.
For traders, among the key levels to watch was the 0.382 Fibonacci retracement level, currently near $73,500.
“In a bull market, the 38.2% Fibonacci retracement acts as key support,” popular trader Titan of Crypto explained, describing BTC/USD as “in a reversal zone.”
“As long as BTC closes above it, the uptrend remains intact, even with a wick below.”BTC/USD 1-month chart with Fibonacci levels. Source: Titan of Crypto/X
Fellow trader Daan Crypto Trades also underscored the level’s potential significance, with it coinciding with old all-time highs from March 2024.
“$BTC Has respected its .382 Fibonacci retracements, measured from the cycle bottom to the local tops, quite well so far,” he told X followers.
“This is the 3rd time we get such a test this cycle. This time we got some confluence from the 2024 highs as well. Big level to watch.”Other important trend lines, as Cointelegraph reported, include the 200-day simple moving average (SMA), a classic bull market support line that was lost when BTC first fell below $82,000.
BTC/USD 1-day chart with 200 SMA. Source: Cointelegraph/TradingView
This article does not contain investment advice or recommendations. Every investment and trading move involves risk, and readers should conduct their own research when making a decision.
Why this matters
This bitcoin story adds another data point to the current market tape and is useful when read alongside nearby source coverage.
Original source
Read on CointelegraphRelated market context
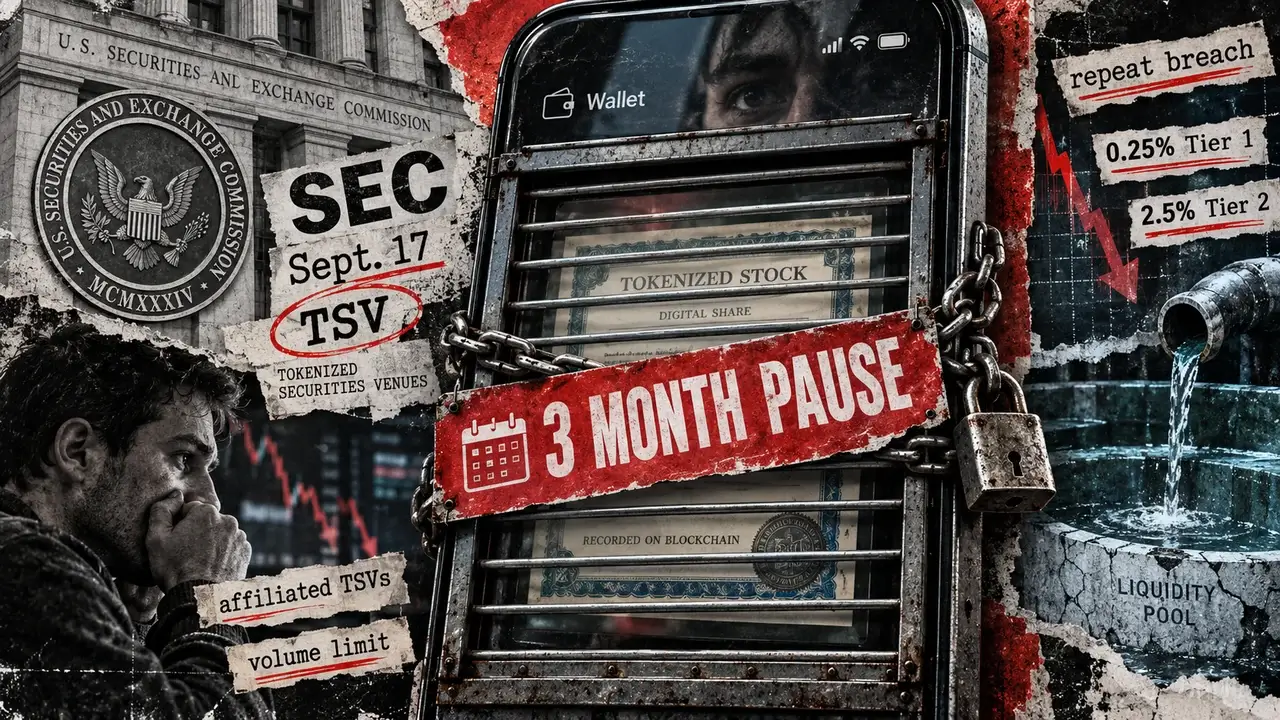
Why your tokenized stock could stop trading for three months
Buying a tokenized stock sounds as though it should be simple. You pick a company you know, buy a token representing its shares, a...
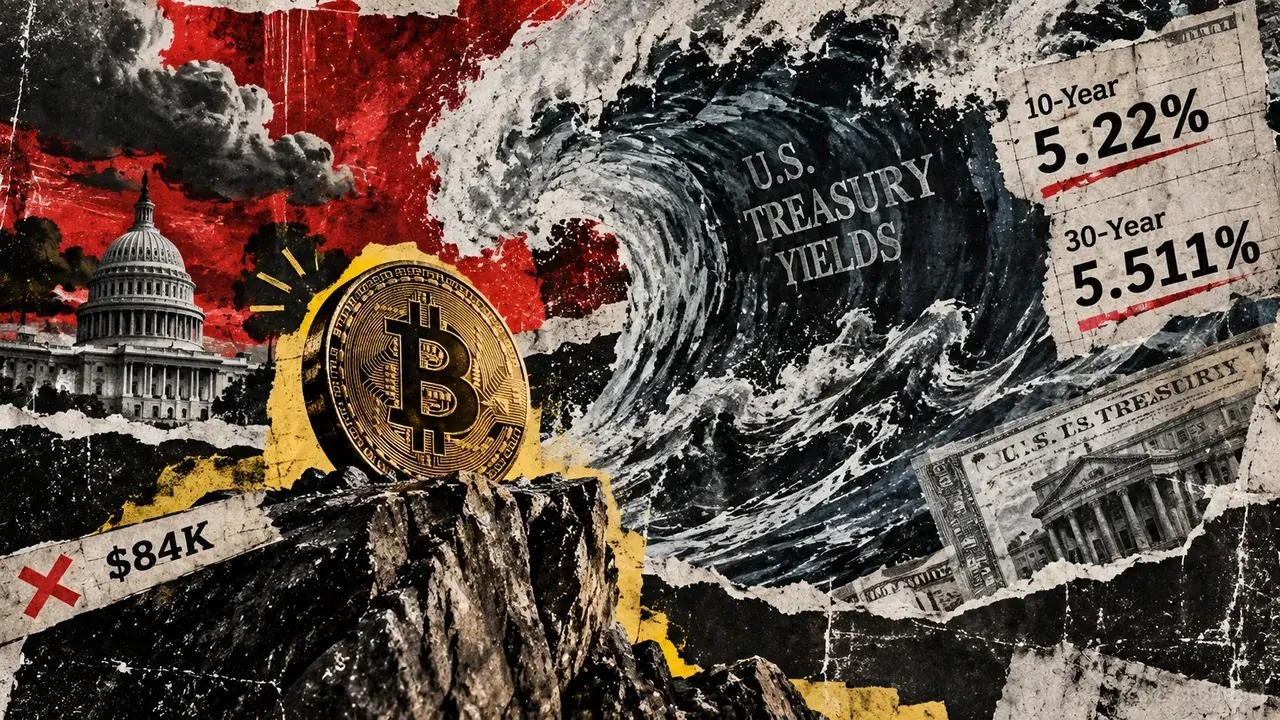
Bitcoin survives a 5.2% Treasury shock as traders slash $1.7 billion in leverage
Bitcoin is holding near $84,000 even as a historic US bond selloff pushes Treasury yields to decades-high levels. The benchmark 10...

Who Bought Bitcoin’s Breakout? The Answer Will Decide Whether The Price Holds
In August, bitcoin’s rally was driven by spot bitcoin ETFs, which bought for nine straight trading days, and by short sellers who...

Claude AI Predicts XRP Could Hit $10 in 2026: How Does it Get There
In ideal bull-market conditions, Anthropic’s Claude AI predicts Ripple (XRP) could hit $10, assuming sustained liquidity, expandin...
Crypto ATM Numbers Fall to 2021 Levels Amid Regulatory Crackdown
According to statistics from the cryptocurrency automated teller machine (ATM) aggregation website, coinatmradar.com, the number o...

Ripple CEO Brad Garlinghouse Says XRP and Solana Can Both Thrive in Crypto’s Next 5 Years
Garlinghouse’s comments have resurfaced as XRP and Solana both trade near important technical levels following recent gains. “I’m...