Bitcoin Short-Term Holders Flip To Losses For First Time Since January
Bitcoin is under pressure after struggling for several days to hold above the $120,000 mark, and now the $115,000 level has become the key battleground. The latest price action shows increased volatility as momentum shif...
Archive context
Older archive item. Useful for background and entity history, but not a fresh market-moving signal.

Bitcoin is under pressure after struggling for several days to hold above the $120,000 mark, and now the $115,000 level has become the key battleground. The latest price action shows increased volatility as momentum shifts toward the bears, raising concerns about whether BTC can sustain its consolidation range or risk breaking lower.
Despite reaching new all-time highs earlier this month, Bitcoin’s inability to maintain strength above resistance zones has fueled speculation of a possible deeper correction. Traders are closely watching whether this consolidation phase is a healthy reset or the beginning of a sharper downturn.
Adding to this uncertainty, CryptoQuant analyst Kerem revealed that for the first time since January, Bitcoin’s short-term holders (STHs) are back to selling at a loss. This marks a critical change in market dynamics, as earlier in the year, STH loss realization coincided with the deepest correction of the cycle. While such loss-selling can often signal weakening momentum, history also shows that it can act as a healthy reset, flushing out weaker hands before a stronger rally.
Short-Term Holders Back to Selling at a LossAccording to CryptoQuant analyst Kerem, Bitcoin’s short-term holders (STHs) are once again showing signs of weakness in the market. The last time this group moved into sustained loss realization was in January 2025, during a phase that marked the deepest correction of the current cycle. Following that drawdown, the market rebounded strongly, and STHs consistently sold their coins at a profit as BTC climbed into six-figure territory.
Now, for the first time since that January reset, STH-SOPR multiples have slipped below 1, confirming that short-term investors are realizing losses. This shift is notable because it often acts as an important turning point in Bitcoin cycles.
Historically, such moves have carried two main implications. On the bearish side, extended periods of loss realization frequently precede deeper corrective phases, when speculative holders exit positions under pressure. On the bullish side, brief dips below 1 can act as a healthy reset, flushing out weaker hands and clearing the way for more sustainable rallies.
With Bitcoin consolidating under heavy resistance after setting new all-time highs, this development becomes a critical barometer of market health. If the market absorbs this wave of loss-selling quickly, BTC could mirror past resets that paved the way for powerful rebounds. However, if loss realization deepens and persists, it may confirm a shift in momentum — signaling a potential breakdown of the bullish structure and raising the risk of further correction.
Testing Key Demand LevelBitcoin continues to trade with elevated volatility, consolidating just above $115,000 after failing to sustain momentum near the $124,000 level. The chart shows that BTC is currently holding near its 50-day moving average (around $115,900), which has now become a critical short-term support zone. A decisive break below this level could open the door for a deeper retrace toward the 100-day MA at $110,957 or even the 200-day MA near $100,410 if selling pressure intensifies.
On the upside, the $123,217 level marked on the chart remains a key resistance point. This zone has repeatedly capped Bitcoin’s upward momentum and will likely continue to act as a major hurdle before BTC can attempt another push toward new all-time highs.
Momentum indicators highlight weakening bullish strength as BTC fails to reclaim the upper resistance band, signaling a potential shift toward consolidation or correction. However, the broader structure still shows higher lows and strong medium-term support, keeping the longer-term bullish trend intact.
Featured image from Dall-E, chart from TradingView
Why this matters
This bitcoin story adds another data point to the current market tape and is useful when read alongside nearby source coverage.
Original source
Read on NewsBTCRelated market context

Solana surpasses 1 million tokenized equity holders for first time
Solana's rapid growth in tokenized equities signals a transformative shift in financial markets, enhancing accessibility and liqui...
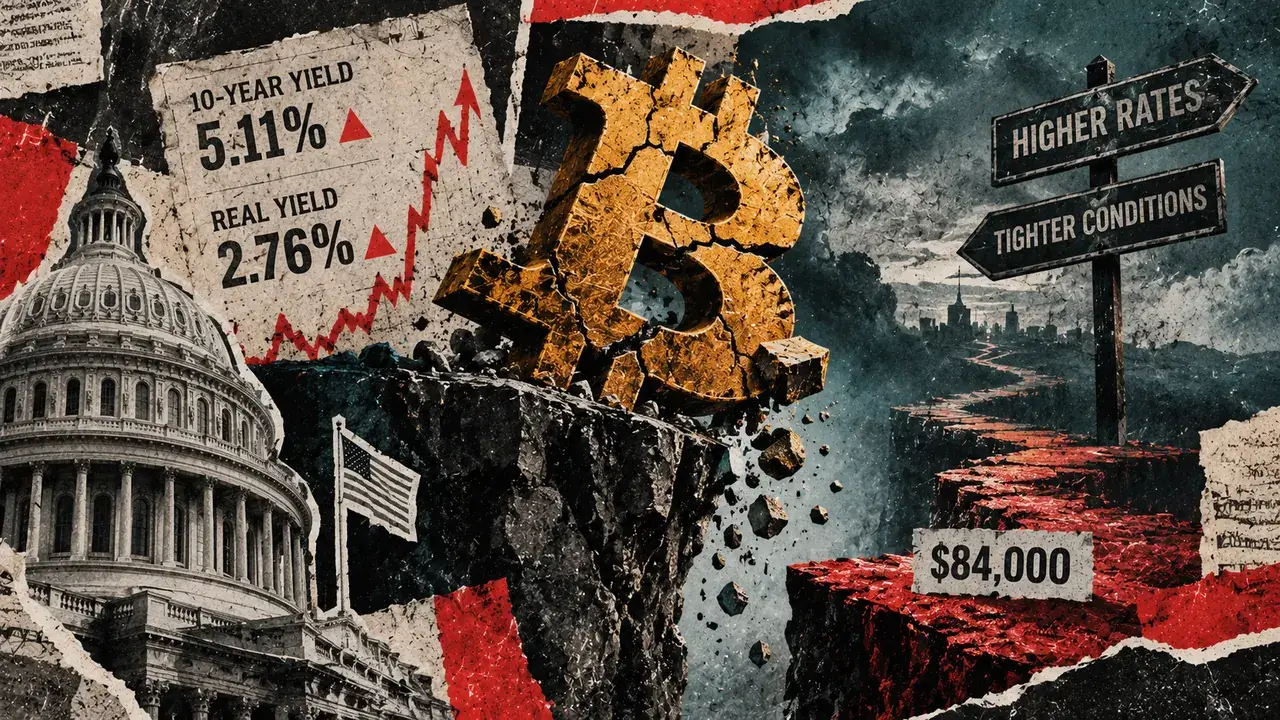
Why surging US real yields are quietly forcing Bitcoin under $84,000
Bitcoin registered an intraday low at $83,500 on Sept. 23, the same day the US 10-year Treasury yield closed at 5.11%, up 15 basis...

Ethereum Price Prediction: BlackRock Says AI Stablecoin Payments Could Drive ETH Demand
Ethereum trades at $2,695, down 2.6% over the past 24 hours, with the latest price prediction still shaped by its 10.3% seven-day...

Microsoft Copilot AI Predicts Bitcoin Will Do Something Incredible in Q4 2026
Microsoft Copilot AI predicts a wild move for BTC in Q4 2026, calling it one of the strongest asymmetric risk-reward positions ava...

XRP Price Under Pressure: Spot Selling Overwhelms ETF Demand
XRP price is hovering at the $1.50 level, down 8% over the prior 24 hours after failing to hold the $1.60 level. The drop happens...

Crypto News Today: XRP, Dogecoin Signal Long-Term MVRV Discounts as Bitcoin Holds $82.5K Neckline
On-chain analytics firm Santiment reported that XRP’s 365-day Market Value to Realized Value (MVRV) stood at approximately -11.75%...