Bitcoin Slides Deeper Into Red, Extending Decline Toward Key Support Zones
Bitcoin price failed to recover above $96,500. BTC is down over 3% and there are chances of more downsides below $92,000. Bitcoin started a fresh decline below $95,000 and $94,500. The price is trading below $98,000 and...
Archive context
Older archive item. Useful for background and entity history, but not a fresh market-moving signal.

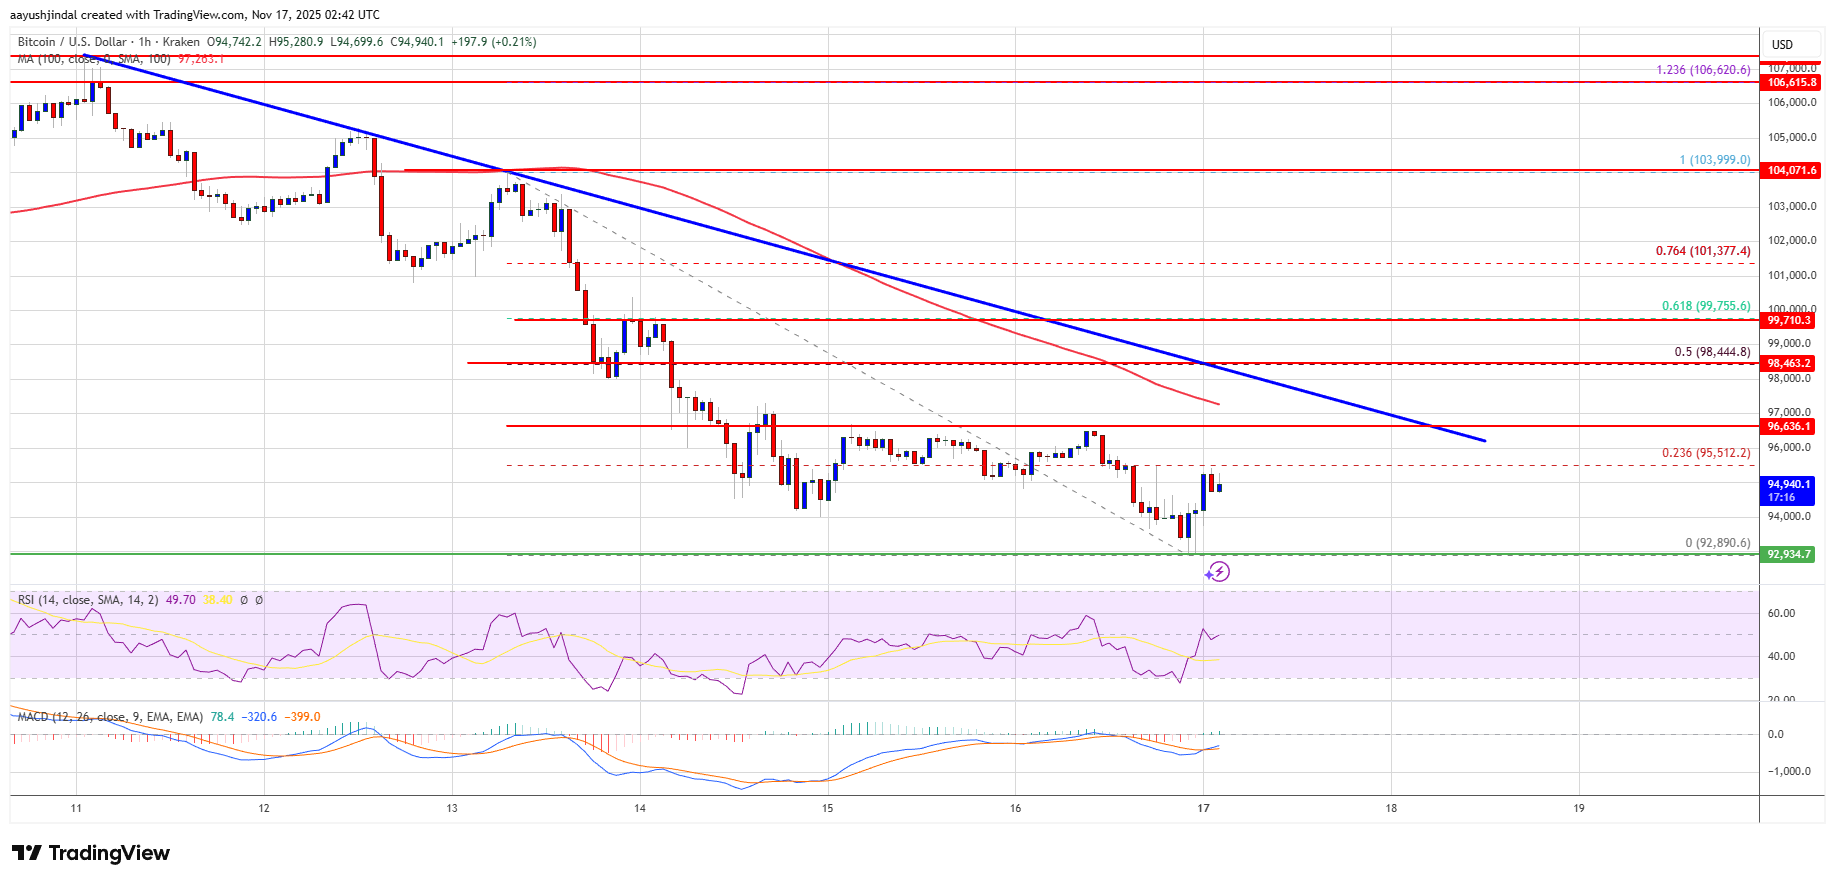
Bitcoin price failed to recover above $96,500. BTC is down over 3% and there are chances of more downsides below $92,000.
- Bitcoin started a fresh decline below $95,000 and $94,500.
- The price is trading below $98,000 and the 100 hourly Simple moving average.
- There is a bearish trend line forming with resistance at $96,600 on the hourly chart of the BTC/USD pair (data feed from Kraken).
- The pair might continue to move down if it settles below the $92,500 zone.
Bitcoin price failed to stay in a positive zone above the $95,500 pivot level. BTC bears remained active below $95,500 and pushed the price lower.
The bears gained strength and were able to push the price below the $94,000 zone. A low was formed at $92,890 and the price is now consolidating losses near the 23.6% Fib retracement level of the recent decline from the $103,998 swing high to the $92,890 low.
Bitcoin is now trading below $95,000 and the 100 hourly Simple moving average. Besides, there is a bearish trend line forming with resistance at $96,600 on the hourly chart of the BTC/USD pair.
If the bulls attempt another recovery wave, the price could face resistance near the $95,500 level. The first key resistance is near the $96,500 level and the trend line. The next resistance could be $97,200. A close above the $97,200 resistance might send the price further higher. In the stated case, the price could rise and test the $98,500 resistance. Any more gains might send the price toward the $99,500 level. The next barrier for the bulls could be $100,000 and $100,500.
More Losses In BTC?If Bitcoin fails to rise above the $96,600 resistance zone, it could start another decline. Immediate support is near the $93,500 level. The first major support is near the $92,500 level.
The next support is now near the $91,500 zone. Any more losses might send the price toward the $90,000 support in the near term. The main support sits at $88,500, below which BTC might accelerate lower in the near term.
Technical indicators:
Hourly MACD – The MACD is now gaining pace in the bearish zone.
Hourly RSI (Relative Strength Index) – The RSI for BTC/USD is now below the 50 level.
Major Support Levels – $92,500, followed by $90,000.
Major Resistance Levels – $95,500 and $96,600.
Why this matters
This bitcoin story adds another data point to the current market tape and is useful when read alongside nearby source coverage.
Original source
Read on NewsBTCRelated market context

Ethereum (ETH) Price Prediction: ETH Holds Near $1,780 as Bulls Eye $1,860–$1,950, but $1,609 Remains Key Invalidation
Ethereum price is trading near $1,779 after a mixed 24-hour session, according to Brave New Coin data. ETH is down around 0.76% on...

Bitcoin (BTC) Price Prediction: BTC Holds $63K Support—Can Rising Active Addresses Offset Bearish Technical Signals?
Although the BTC price has remained near a key support zone, recent chart signals and Strategy’s sale of a portion of its Bitcoin...

Bitcoin Price Prediction: Peter Brandt Might Dump BTC for Gold
Bitcoin is facing a test, and its price prediction is not helping. So far in 2026, BTC has fallen about 28%, while gold is down ju...

XRP Price Prediction: Volume and ETF Inflow Send Ripple Token Higher
XRP price pushed above the $1.14 resistance area after buyers stepped in with heavy volume and bullish prediction. The token climb...

Ethereum Price Prediction: Vitalik Hints at 3-4 Years Long ETH Rebuild
Ethereum price is trading at $1,780 as Vitalik Buterin revealed the network’s biggest roadmap since the Merge, which somehow sends...

Ethereum’s EIP-8222 wants to make staking anonymous, and it might actually work
EIP-8222 could enhance Ethereum's privacy, potentially boosting user confidence but also attracting regulatory scrutiny over anony...