Bitcoin Stablecoin Supply Ratio Now Forms A “Buy” Signal
On-chain data shows the Bitcoin stablecoin supply ratio is now showing a green signal that has proved to be profitable for the crypto several times in the last two years. Bitcoin Stablecoin Supply Ratio Shock Momentum Fo...
Archive context
Older archive item. Useful for background and entity history, but not a fresh market-moving signal.

On-chain data shows the Bitcoin stablecoin supply ratio is now showing a green signal that has proved to be profitable for the crypto several times in the last two years.
Bitcoin Stablecoin Supply Ratio Shock Momentum Forms “Buy” SignalAs pointed out by an analyst in a CryptoQuant post, out of the 11 previous such buy signals, 10 ended up profitable for the crypto.
The “stablecoin supply ratio” (or the SSR in brief) is an indicator that measures the ratio between the market cap of Bitcoin and that of all stablecoins.
Generally, whenever investors want to avoid volatility associated with cryptos like BTC, they shift their coins into stablecoins. Once they feel that prices are right to re-enter the markets again, they buy back into them. As such, the total stablecoin supply can be looked at as potential buying pressure for other cryptos.
When the value of the SSR is high, it means the BTC supply is higher compared to the stablecoin cap, and thus there is low buying pressure in the market currently.
On the other hand, low values of the indicator suggest there is high potential dry powder in the market right now. Because of this, such a trend can be bullish for the price of Bitcoin.
Now, there is a metric called the Bitcoin SSR “shock momentum,” which tracks the rate of change in its value. Here is a chart that shows the trend for it over the past couple of years:
Looks like the value of the metric has been low in recent days | Source: CryptoQuantAs you can see in the above graph, the quant from the post has marked the relevant points of trend for the Bitcoin SSR shock momentum.
It seems like whenever this metric has made a low below the green dotted level, the price of the crypto has observed a buy signal.
During the last two years, there have been eleven instances of this pattern taking place, out of which only one has turned out to be a false signal.
Most recently, the indicator has once again showed this formation. If the past trend is anything to go by, then this may turn out to be bullish for Bitcoin.
BTC PriceAt the time of writing, Bitcoin’s price floats around $20.9k, up 4% in the past week. Over the last month, the crypto has lost 12% in value.
The below chart shows the trend in the BTC price over the last five days.
The value of the crypto seems to have spiked up over the past day | Source: BTCUSD on TradingView Featured image from Quaritsch Photography on Unsplash.com, charts from TradingView.com, CryptoQuant.comWhy this matters
This bitcoin story adds another data point to the current market tape and is useful when read alongside nearby source coverage.
Original source
Read on NewsBTCRelated market context

Ethereum Foundation Launches Devcon 8 Ticket Sales For Bangkok Conference
The market has had plenty to digest this week, so not every headline deserves the same treatment. This one does, because ethereum...

GENIUS Act Deadline Puts Stablecoin Rulemaking Back On Washington’s Clock
Crypto does not move on one kind of catalyst. Some days it is price, some days it is policy, and some days it is infrastructure. G...
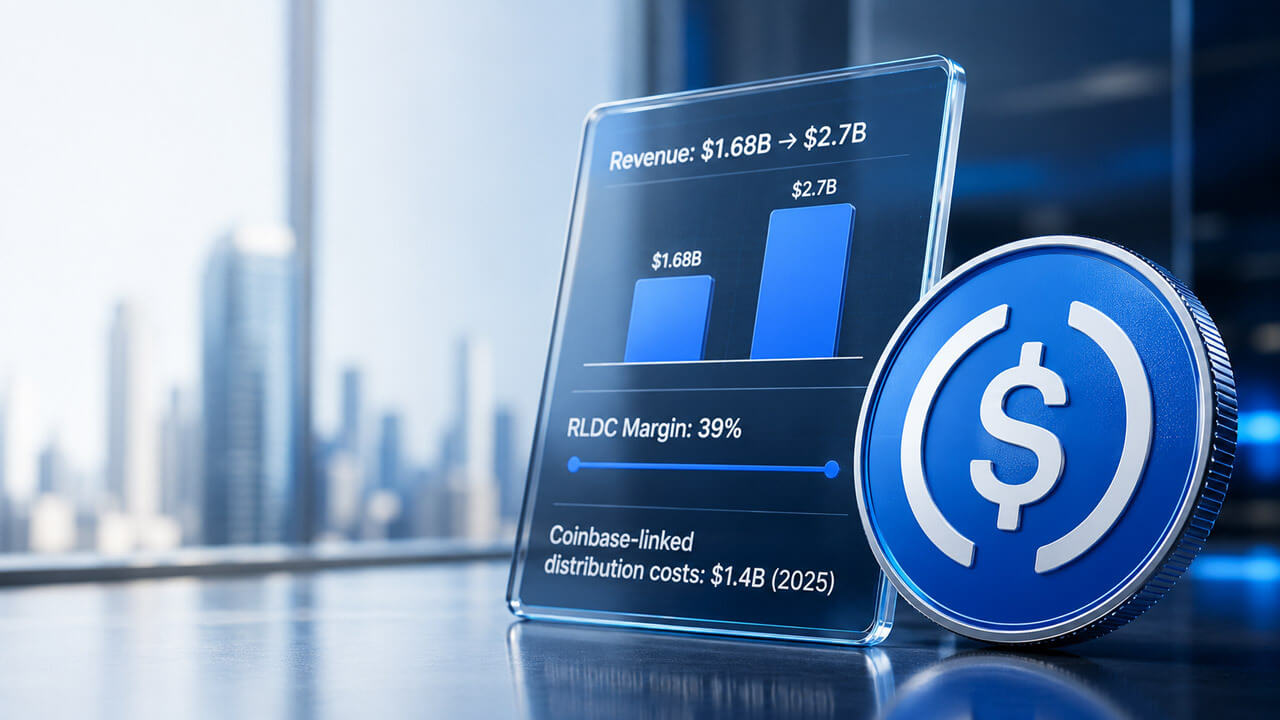
USDC’s 72% surge exposed the expensive truth behind Circle’s stablecoin dominance
Circle incurred $1.4 billion in distribution costs connected to Coinbase in 2025, up from $924.5 million the year before, accordin...

US turns stablecoin issuer Tether into a financial weapon against Iran, freezing nearly $500 million
US authorities have used Tether's control over its dollar-linked stablecoin to freeze about $475 million connected to Iran in less...

Crypto News, July 15: Bitcoin and Ethereum Price Jump on Softer CPI and Japan Bitcoin ETF
Bitcoin and Ethereum price climbed after cooler-than-expected U.S. inflation data improved market sentiment. Just hours after, a J...

Ethereum Reclaims $1,800 As ETF Hopes Meet A Friendlier Macro Tape
There is a useful difference between a noisy headline and a story that actually changes the market’s understanding of a sector. Et...