Bitcoin Supply-Loss Chart Flashes Possible Bottom Signal — Is Reversal Emerging?
The cryptocurrency market has weathered a challenging period, testing the resolve of the most seasoned investors. After a prolonged period of downward pressure, the Bitcoin Supply-Loss Chart is flashing a possible bottom...
Archive context
Older archive item. Useful for background and entity history, but not a fresh market-moving signal.

The cryptocurrency market has weathered a challenging period, testing the resolve of the most seasoned investors. After a prolonged period of downward pressure, the Bitcoin Supply-Loss Chart is flashing a possible bottom signal.
A Deeper Look At Bitcoin Supply In Loss ChartBitcoin on-chain data on the loss chart is currently flashing a possible bottom. In an X post, CryptosRus has revealed that the supply in the Loss metric chart tracks the total amount of BTC held by addresses where the current market price is below the average cost basis of those holdings. Essentially, the portion of BTC owners is currently underwater on their investment.
As a sentiment indicator, the high levels of supply in the Loss chart typically signal fear, capitulation selling, and potential market bottoms. In addition, the low levels indicate broad profitability and market greed.
On April 7, 2025, when BTC traded around $74,508, the supply in loss was 5.159 million BTC. By November 5, 2025, even with BTC rising to $98,966, the supply in loss had also increased to 5.639 million BTC. During mid-2024, a similar situation reportedly occurred, marking the bottom at that time. The expert also outlined particular areas on the chart marked as 3, 4, and 5, which show uncanny similarities.
Furthermore, in October 2025, recent lows showed a sharp spike in losses amid volatility, with approximately 30% of supply going underwater. On the chart, the yellow boxes highlight a rapid build-up, which has been a potent precursor to the market bottom.
Currently, the supply in the loss has climbed to 28% and 33%, which is equivalent to 5.5 million BTC to 6.5 million BTC, matching the October endpoint on the chart and echoing the correction patterns seen in 2024. CryptosRus concluded that this may bring short-term bearish pressure, but it could flush out the final weak holders, opening the way for a bounce in Q4 and Q1 2026.
The Accumulation Phase Before The BreakoutBitcoin has experienced three major corrections in this cycle, and each one has eventually led to a new all-time high after months of conviction. According to an analyst known as 0xBossman, this correction is no different, and each of these corrections has been brutal in its own way. BTC’s market flushed out the leveraged traders, resulting in them losing it all.
Meanwhile, the boredom that comes as a result of these corrections is what has led to the bearish sentiment. The market feels indecisive, and altcoins have bled. Thus, 0xBossman advised that traders should step back and realize that this consolidation will end with a massive green candle.
Why this matters
This bitcoin story adds another data point to the current market tape and is useful when read alongside nearby source coverage.
Original source
Read on NewsBTCRelated market context

Circle pays millions for Binance distribution while its margins collapse
Circle is doubling down on Binance after USD Coin (USDC) stablecoin customer balances on the exchange nearly quintupled since thei...

Coinbase traced $1.1 million crypto trail behind AI phishing service EvilTokens
Microsoft and Coinbase helped dismantle EvilTokens, an AI phishing service tied to more than 12,000 compromised inboxes worldwide....
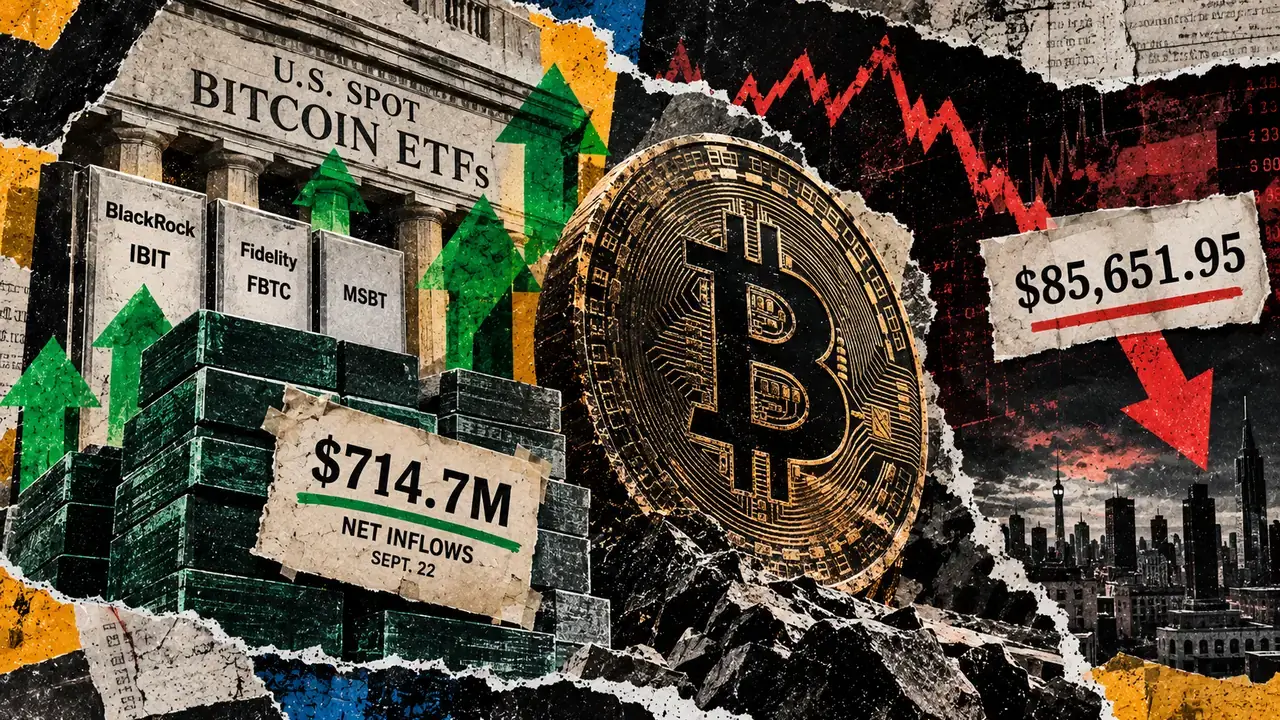
Bitcoin ETFs just erased a $5.7 billion hole, but profit-taking is swallowing the new demand
Bitcoin exchange-traded funds (ETFs) have erased their 2026 flow deficit after a sharp buying revival, even as the top crypto stru...

Blockchain.com and NYSE Plan to Bring Tokenized Stocks to 44 Million Crypto Accounts
Blockchain.com plans to offer its users tokenized versions of U.S. exchange-listed stocks and ETFs through the New York Stock Exch...

XRP Price Today: XRP Hits $1.60 as Heavy Whale Accumulation Points to a $2 Rally and Beyond
The XRP price reached $1.6060 on September 23 after opening near $1.5808, according to historical market data. The token subsequen...

NYSE and Blockchain.com Plot 24/7 Stocks for 44 Million Users
The New York Stock Exchange (NYSE) has signed an agreement that could eventually put tokenized U.S. stocks and ETFs inside Blockch...