Bitcoin traders warn BTC price rally may stall at $90K
Bitcoin (BTC) rallied above $89,000 on April 22, its highest level since early March, buoyed by strong spot demand during US trading hours on April 21. The recovery, however, faced a serious challenge in breaking above $...
Archive context
Older archive item. Useful for background and entity history, but not a fresh market-moving signal.

Bitcoin (BTC) rallied above $89,000 on April 22, its highest level since early March, buoyed by strong spot demand during US trading hours on April 21. The recovery, however, faced a serious challenge in breaking above $90,000 as sell-side liquidity blocked the way.BTC/USD daily chart. Source: Cointelegraph/TradingView
Bitcoin price faces stiff resistance on the upsideData from Cointelegraph Markets Pro and TradingView shows that the price has been steadily moving toward the $89,000 level over the last six hours, leading to questions about whether the barrier at $90,00 will finally give in.
BTC/USD hourly chart. Source: Cointelegraph/TradingView“BTC is closing in on the big $90K-$91K horizontal area which acted as the previous range low,” said popular trader Daan Crypto Trades in an April 22 post on X.
The trader explained that the price had swept the $89,000 level as it was consolidating below it. Note that the 200-day simple moving average (SMA) is currently located just above this level, reinforcing its significance.
Daan Crypto Trades said that the price needs to overcome these barriers in order to confirm a breakout.
“Quite a few resistances close by, but a few percentage moves and you'll break through all of them, and the chart looks pretty great. Bulls know what to do.”BTC/USD daily chart. Source: Daan Crypto TradesBitcoin price breaking $91-$92K is key — AnalystMeanwhile, CryptoQuant’s head of Research, Julio Moreno, said that the traders’ onchain realized price between $91,000 and $92,000 is the real test for Bitcoin bulls.
Related: Bitcoin risks 10%-15% BTC price dip after key rejection near $89K
According to Moreno, the traders’ realized price usually acts as resistance when the crypto market is bearish, which is the current situation of Bitcoin.
Source: Julio MorenoThis article does not contain investment advice or recommendations. Every investment and trading move involves risk, and readers should conduct their own research when making a decision.
Bitcoin (BTC) rallied above $89,000 on April 22, its highest level since early March, buoyed by strong spot demand during US trading hours on April 21. The recovery, however, faced a serious challenge in breaking above $90,000 as sell-side liquidity blocked the way.
BTC/USD daily chart. Source: Cointelegraph/TradingViewBitcoin price faces stiff resistance on the upsideData from Cointelegraph Markets Pro and TradingView shows that the price has been steadily moving toward the $89,000 level over the last six hours, leading to questions about whether the barrier at $90,00 will finally give in.
BTC/USD hourly chart. Source: Cointelegraph/TradingView“BTC is closing in on the big $ 90 K-$91 K horizontal area which acted as the previous range low,” said popular trader Daan Crypto Trades in an April 22 post on X.
The trader explained that the price had swept the $89,000 level as it was consolidating below it. Note that the 200-day simple moving average (SMA) is currently located just above this level, reinforcing its significance.
Daan Crypto Trades said that the price needs to overcome these barriers in order to confirm a breakout.
“Quite a few resistances close by, but a few percentage moves and you'll break through all of them, and the chart looks pretty great. Bulls know what to do.”BTC/USD daily chart. Source: Daan Crypto TradesBitcoin price breaking $91-$92K is key — AnalystMeanwhile, CryptoQuant’s head of Research, Julio Moreno, said that the traders’ onchain realized price between $91,000 and $92,000 is the real test for Bitcoin bulls.
Related: Bitcoin risks 10%-15% BTC price dip after key rejection near $89K
According to Moreno, the traders’ realized price usually acts as resistance when the crypto market is bearish, which is the current situation of Bitcoin.
Source: Julio MorenoThis article does not contain investment advice or recommendations. Every investment and trading move involves risk, and readers should conduct their own research when making a decision.
Why this matters
This bitcoin story adds another data point to the current market tape and is useful when read alongside nearby source coverage.
Original source
Read on CointelegraphRelated market context
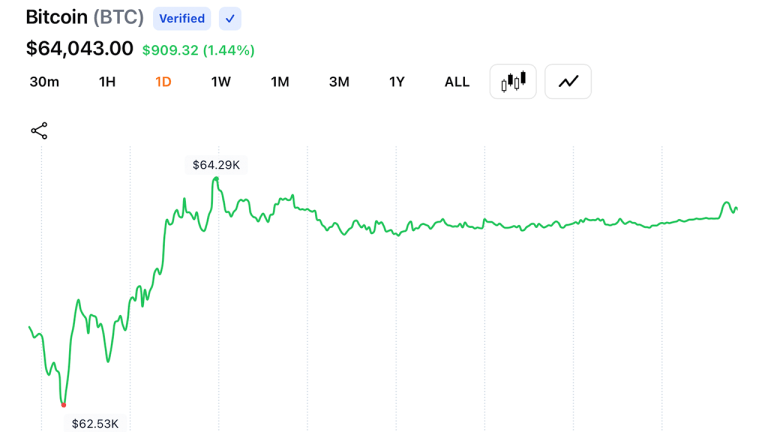
Bitcoin Faces $65,500 Wall as Daily Chart Volume Cools After Mid-July Rebound
Bitcoin trades near $64,000 on July 18, 2026, at 8:30 a.m. EDT, holding inside a tight range after bouncing off a 24-hour low of $...

XRP Stalls Below Resistance As Traders Wait For Regulatory Relief To Turn Into Demand
XRP is still struggling to turn better regulatory sentiment into a clean market breakout. The token has been hovering below the $1...

BTCC Exchange Q2 2026 Growth Report: TradFi Volumes Triple, 12M Users Reached as Exchange Marks 15 Years
George Town, Cayman Islands, July 17th, 2026, Chainwire BTCC, the world’s longest-serving cryptocurrency exchange, today released...

Bitcoin (BTC) Price Prediction: Dormant Whale Activity Sparks Volatility Alert as BTC Hovers Near $64K
A sharp increase in Bitcoin’s age-consumed metric has drawn attention from on-chain analysts, while a large wallet that had remain...

Solana News: SOL Hits 300,000 RWA Holders, Leaving Other Chains in the Dust
In the latest Solana news, the SOL real-world asset ecosystem just crossed 300,000 unique holders, a milestone no competing chain...

Cardano Tests Support As ADA Traders Look For A Better Catalyst
Cardano is trading near support as ADA investors look for a stronger reason to step back into the market. The project still has on...