Bitcoin Weekly TD Sequential Buy Setup Appears, But Warns Of Potential Risk
Bitcoin price keeps falling, now pushing down against support at $25,000 per coin. The recent sweep of lows has resulted in a perfected TD9 buy setup according to the weekly TD Sequential indicator. Although this sounds...
Archive context
Older archive item. Useful for background and entity history, but not a fresh market-moving signal.
Bitcoin price keeps falling, now pushing down against support at $25,000 per coin. The recent sweep of lows has resulted in a perfected TD9 buy setup according to the weekly TD Sequential indicator.
Although this sounds positive for crypto, if the signal fails, there is risk of an extreme drop ahead. Here is a closer look at why.
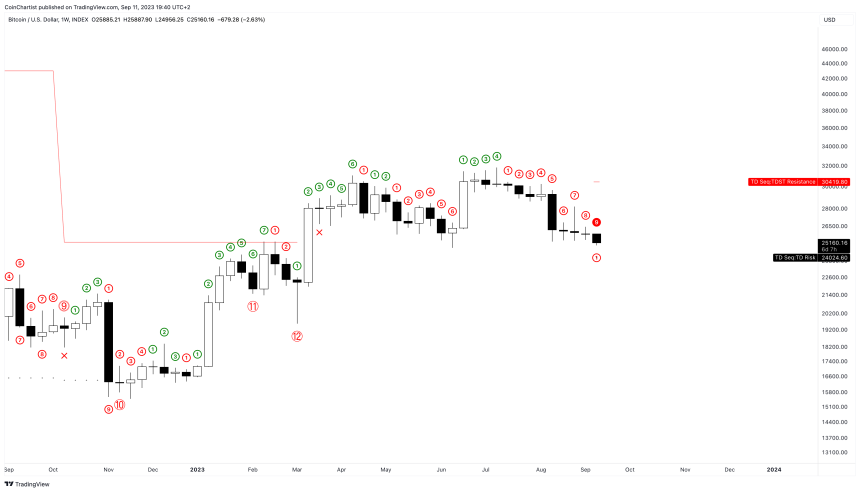
Is The TD Sequential Telling Us To Buy The Dip In Bitcoin?Things are improving for Bitcoin price action, but the situation surrounding altcoins and the increasingly negative macro environment has kept upside momentum at bay. The result over the last several weeks has been another BTCUSD downtrend. This series of down weeks has satisfied a specific sequence required to trigger a TD9 buy setup.
Even more important, the signal has been “perfected” now that price has made a lower low on weekly timeframes. The TD Sequential is a market timing indicator created by Thomas DeMark, which can be used to potentially time reversals. However, when a buy signal fails, the move down can be dramatic.
The last time there was a perfected TD buy setup series in the same timeframe, Bitcoin was priced at $42,000 per coin. There was a short-lived recovery, but a more than 50% collapse followed due to the buy setup failure.
If the buy setup doesn’t fail here, Bitcoin should reverse before the week is over, resuming its prior bullish 2023 uptrend.
A Broader Look At The Brewing BTC TrendUpon zooming out, we can also see that Bitcoin’s uptrend from $3,000 is still intact, according to TDST support located at $10,376. TDST support only moves up when a TD series is perfected to the upside and a sell setup triggered. Instead, the perfected TD9 buy setup has renewed TDST resistance at $30,419.
Former TDST resistance was located at $25,250, which is potentially being retested now. Based on what the technical indicator tells us, is that Bitcoin is facing a critical inflection point in terms of timing and price level combined. However the dust settles could determine the future trend for the remainder of the year.
Will this TD buy setup lead to a reversal, or further failure for bulls to establish a new bull market?
Why this matters
This bitcoin story adds another data point to the current market tape and is useful when read alongside nearby source coverage.
Original source
Read on NewsBTCRelated market context

AscendEX shuts down after MiCA miss and warns some withdrawals may not be processed
AscendEX shut down on July 1, leaving some customers unsure whether they will recover their funds. The exchange said in a July 6 n...

Ethereum Foundation AI Agent Research Shows Where Smart Contracts May Be Heading Next
Ethereum Foundation AI Agent Research Shows Where Smart Contracts May Be Heading Next is the kind of crypto story that looks simpl...

VanEck Ethereum ETF Update Adds More Fee Pressure To The Fund Launch Race
VanEck Ethereum ETF Update Adds More Fee Pressure To The Fund Launch Race is the kind of crypto story that looks simple at headlin...

Vitalik Buterin’s Single Slot Finality Plan Shows Ethereum Still Has A Settlement-Speed Problem To Solve
Vitalik Buterin’s Single Slot Finality Plan Shows Ethereum Still Has A Settlement-Speed Problem To Solve is the kind of crypto sto...

Ex-SWIFT CIO Tom Zschach Shuts Down XRP Partnership Claims in Two Words
Tom Zschach, who spent six years as SWIFT’s Chief Innovation Officer before recently leaving the company, pushed back against fres...

New Hampshire Council Votes Down First-in-Nation $100 Million Bitcoin Bond
New Hampshire’s Executive Council voted down a proposed $100 million municipal bond backed by Bitcoin on Wednesday, killing what s...