Bitcoin’s Bullish Leap: Trading Guru John Bollinger Weighs In On BTC Ongoing Rally
John Bollinger, known for his expertise in market analysis, has recently shared his insights on Bitcoin’s current market trajectory, noting that the premier cryptocurrency is exhibiting “signs of strength.” This observat...
Archive context
Older archive item. Useful for background and entity history, but not a fresh market-moving signal.

John Bollinger, known for his expertise in market analysis, has recently shared his insights on Bitcoin’s current market trajectory, noting that the premier cryptocurrency is exhibiting “signs of strength.” This observation comes when Bitcoin consistently sets new highs amid the ongoing bull run.
The asset has experienced a surge, climbing above $44,000, representing a 4.5% increase over the past 24 hours. It now appears to be aiming for the next resistance level.
Bitcoin Shows Signs Of StrengthJohn Bollinger, the creator of the renowned Bollinger Bands, a popular technical analysis tool, has applied his methodology to gauge Bitcoin’s market movement. Bollinger Bands are typically used to measure the volatility of a financial instrument.
They consist of a middle band, a simple moving average flanked by two standard deviation lines. These bands adjust with market conditions, widening during volatile periods and contracting during calmer times.
Bollinger’s recent analysis highlights that Bitcoin trades outside its daily and weekly Bollinger Bands. This is particularly noteworthy as it suggests a strong continuation of the current bullish trend without any signs of divergence.
On November 21, a two-bar reversal pattern was noted at the middle Bollinger Band, further reinforcing the strength in Bitcoin’s price action.
The air is getting a bit thin up here, but all we see as of now are signs of strength. We are outside both the daily and weekly BBs with no divergences. The last controlling formation was the 2 bar reversal at the middle BB completed on 21 Nov. $BTCUSDhttps://t.co/B4ZU3vpTvV
— John Bollinger (@bbands) December 5, 2023
Bitcoin’s Price Action: Interpreting The SignsBitcoin’s bullish momentum continues unabated, with a near 5% surge in the past 24 hours, pushing past the $44,000 threshold. Interestingly, the cryptocurrency shows no signs of deceleration or immediate pullback.
However, technical analysis on a larger scale suggests that Bitcoin might be approaching a significant retracement zone. On the one-week timeframe, an order block is present between the $48,000 and $50,000 regions.
An order block is essentially a zone where significant buying or selling occurred in the past, leading to a substantial price movement. When the price revisits these blocks, they often act as key levels for potential reversals or trend continuation.
Should Bitcoin climb to this region, a retracement might be on the cards. However, invalidating this order block and continuing its rally might set the stage for a reversal, possibly when it reaches the breaker block around the $60,000 region.
A breaker block is a specific price zone where the market has previously shown a substantial reversal, breaking through a level of resistance or support. These blocks are often seen as potential areas where the price might experience significant movements or change direction. If Bitcoin taps into this breaker block, it could indicate another pivotal moment in its price trajectory.
Featured image from Unsplash, Chart from TradingView
Why this matters
This bitcoin story adds another data point to the current market tape and is useful when read alongside nearby source coverage.
Original source
Read on NewsBTCRelated market context

Coinbase website goes unreachable for some users after court-ordered block
Court-ordered blocks on platforms like Coinbase highlight the growing tension between digital markets and regulatory frameworks, i...

Strive stacks 2,822 more Bitcoin, edging past MARA in treasury rankings
Strive's increased Bitcoin holdings highlight the growing trend of corporate investment in cryptocurrencies, impacting market dyna...

Bitcoin (BTC) Price Prediction: Slowing Whale Selling Offers Hope as $81.5K ETF Support Holds
On-chain data indicates that distribution from longer-term holders has slowed, offering some relief to the market. However, weaken...

Binance News: Miners Must Move Before Pool Closes on November 10
In Binance news today, the exchange will shut down Binance Pool and related services at 07:00 UTC on November 10, 2026, ending its...

Polymarket Token Airdrop? TOKEN2049 Talk Fuels Speculation
Polymarket CEO Shayne Coplan revived speculation about a native token at TOKEN2049 Singapore, discussing a possible on-chain asset...
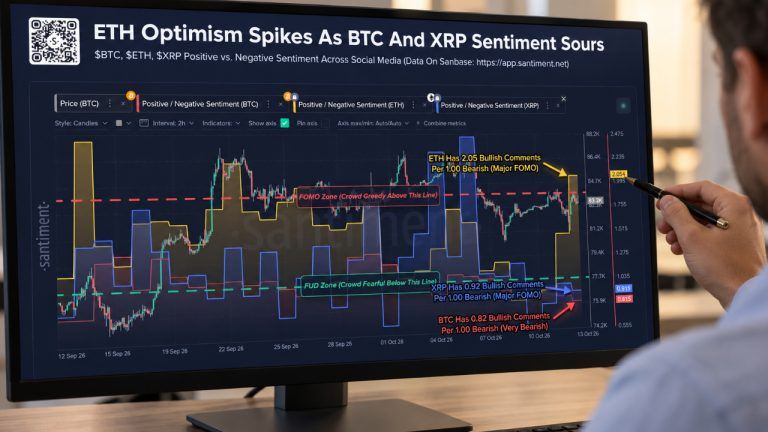
Bitcoin and XRP Sentiment Turn Fearful as Ethereum Draws Bullish Buzz
Bitcoin and XRP social sentiment is bearish after price declines, including XRP’s weekly drop exceeding 9%, while ether attracts r...