Bitcoin’s Final Dip Before $273,000? A Market Veteran Thinks So
In a post shared on X with his 700,000 followers, market veteran CRYPTO₿IRB (@crypto_birb) outlined what he believes could be one of Bitcoin’s final major pullbacks before an eventual surge to a six-figure price target....
Archive context
Older archive item. Useful for background and entity history, but not a fresh market-moving signal.

In a post shared on X with his 700,000 followers, market veteran CRYPTO₿IRB (@crypto_birb) outlined what he believes could be one of Bitcoin’s final major pullbacks before an eventual surge to a six-figure price target. In his own words: “BTC LAST DIPS BEFORE $273K? Here’s why:” He backed up this claim with a series of concise bullet points covering market trends, technical signals, and historical data.
Last Chance to Buy Bitcoin Cheap?CRYPTO₿IRB’s analysis begins with a description of the “Bull Market” environment, noting that both the 200-week and 50-week moving averages are rising. These long-term trends often reflect a broader shift in market sentiment.
He also references the latest data on Bitcoin exchange-traded funds, pointing to total assets under management (AUM) of $121 billion, alongside a substantial trading volume of $746 billion. Another key metric highlighted is the Net Unrealized Profit and Loss (NUPL), which he places at 0.54, suggesting that more traders are in profit than those at a loss. He observes a seven-week correlation to the S&P 500 at 0.25, signaling only a moderate linkage between Bitcoin and the traditional equity market over that period.
The analyst then addresses the “Daily Trend,” indicating that he sees Bitcoin oscillating within a range of $90,000 to $110,000 for now. He situates the 200-day Simple Moving Average at about $80,200 and emphasizes that this figure is trending upward. CRYPTO₿IRB also explains that the proprietary 200-day BPRO indicator sits at approximately $94,400, which he views as another sign of strengthening momentum, despite a 50-day RSI at 42. An RSI below 50 often points to cooled market momentum, yet he notes that volatility appears stalled for the moment, with an Average True Range of $3,360 suggesting that price swings have softened compared to previous periods.
Turning to his “Trade Setup,” CRYPTO₿IRB highlights that he sees certain bearish configurations on his 12-hour BPRO CTF and HTF Trailer indicators. He describes market conditions as choppy, with resistance appearing around the $99,700 to $103,100 range. This implies that if Bitcoin fails to break above that resistance level, short-term pullbacks or sideways activity could continue until buyers regain control.
Regarding “Sentiment & Miners,” the analyst points to a Fear & Greed Index reading of 51, a level considered neutral. He remarks that fear typically spikes just before key breakouts, implying that the absence of extreme fear may indicate a more sustained climb once resistance zones are cleared. He also classifies the ongoing market cycle phase as “belief,” suggesting that investors remain cautiously optimistic without the euphoria that often signals major tops. Another crucial factor is miners’ profitability, which he estimates remains healthy above $88,400, a threshold that can discourage excessive miner selling and help reinforce price floors.
His commentary on “Seasonality” underscores the historical performance of Bitcoin. He notes that February has seen an average gain of 15.85% with positive returns in seven out of ten years. Overall, first quarters tend to deliver around a 25% average gain. From 2010 to 2024, Bitcoin’s annualized return stands at roughly 145%, reflecting the impressive long-term growth that has characterized its history. CRYPTO₿IRB encourages traders to “BTFD Feb–March,” which is short for “buy the dip,” implying that he expects attractive entry points to emerge before the market potentially rallies again.
In explaining the “Macro Top,” he looks to the MVRV Z-Score, a metric that compares market value to realized value. He warns that an MVRV Z-Score above 7.0 traditionally signals an overheated market. Currently at 2.43, the score remains well below that danger zone, which leads him to project a possible peak above $273,000 (2.88x from $95.3k).
He states: “Bitcoin will start forming top over $273k+. According to MVRV Z-Score, the market peaked only when MVRV pushed & stayed for weeks above 7.0 (2.8X from $97.5k). It’s the pre-rich phase.”
At press time, BTC traded at $95,553.
Why this matters
This bitcoin story adds another data point to the current market tape and is useful when read alongside nearby source coverage.
Original source
Read on NewsBTCRelated market context

Bitcoin (BTC) Price Today: BTC Holds Uptrend as $84K FVG Shapes Intraday Setup
The setup comes as on-chain data shows that profit-taking remains relatively contained despite the latest Bitcoin price recovery....
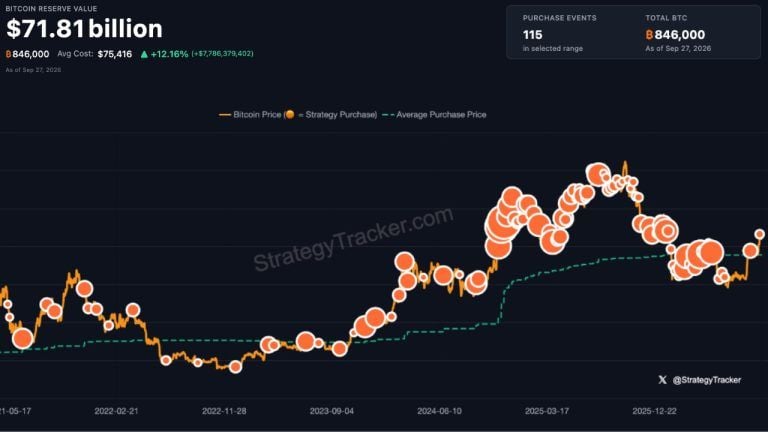
Even More Orange: Saylor Teases Another Strategy Bitcoin Buy
Michael Saylor’s “Even more orange” message has raised the prospect of another Strategy bitcoin purchase following the company’s r...

Quant (QNT) Price Today: QNT Jumps Over 300% in a Week as Tokenized Banking Deal Drives Demand
The sharp move accelerated after The Clearing House selected Quant on September 24 to provide the interoperability, orchestration,...

Claude AI Predicts XRP Could Hit $10 in 2026: How Does it Get There
In ideal bull-market conditions, Anthropic’s Claude AI predicts Ripple (XRP) could hit $10, assuming sustained liquidity, expandin...

Bitcoin Price Never Closed Below Expectation in 2026 Bear Market
Bitcoin never posted a daily close below its realized price during the current bear market, and the June 2026 low held above that...

Elon Musk Grok AI Predicts a Bold Move for Ethereum in 2026
When prompted, the Elon Musk-backed Grok AI predicts a bold move for Ethereum (ETH) over the remainder of 2026. It claims that if...