Bitcoin’s New ‘Line In The Sand’ May Be $82,000, Not $56,000: Analyst
An analyst has explained how Bitcoin’s bottom in the current cycle may not follow the same pattern as historical bear markets. Bitcoin Could Bottom Around True Mean Price Instead This Time In a new post on X, Checkonchai...
Archive context
Older archive item. Useful for background and entity history, but not a fresh market-moving signal.

An analyst has explained how Bitcoin’s bottom in the current cycle may not follow the same pattern as historical bear markets.
Bitcoin Could Bottom Around True Mean Price Instead This TimeIn a new post on X, Checkonchain co-founder Alec Dejanovic has talked about a couple of pricing models related to Bitcoin. The first of these is the “Realized Price,” keeping track of the cost basis of the average investor on the BTC network.
When the BTC spot price is trading above this level, it means that the network as a whole is in a state of net unrealized profit. On the other hand, the asset being under the metric suggests that the average token is being held at some loss.
This indicator has displayed an interesting relationship with the cryptocurrency in the past. “Historical Bitcoin bears usually bottom around the Realised Price level,” explained Dejanovic.
Below is the chart shared by the analyst that shows this effect in action.
As is visible in the graph, the 2015, 2018, and 2022 bear markets all found their bottoms when the Bitcoin spot price plunged under the Realized Price. Even the COVID crash in 2020 bottomed out below the indicator.
The explanation behind this pattern could lie in the fact that below this line, the majority of the network can be considered underwater, so there wouldn’t be many profit-takers left. In these conditions, resolute entities take coins off investors capitulating at a loss and selling pressure slowly reaches exhaustion, allowing BTC to regain its footing.
Today, the Realized Price is situated at $56,000. Considering the past pattern, perhaps this cycle’s bear market would also bottom out around or below this level. Dejanovic thinks things can go differently this time, however, saying, “with ETF flows remaining resilient and no FTX-style fraud in sight, that target feels excessive.”
If not Realized Price, then where else could Bitcoin find its bottom? The answer may be the second price model listed in the chart: the True Mean Price. This metric functions similarly to the Realized Price, except for the fact that it represents the cost basis of just the active market participants, not the entire network.
A chunk of the Bitcoin supply has become lost due to associated wallets no longer being accessible. As BTC is growing older, this supply is only increasing in size, making the Realized Price a somewhat inaccurate representation of the real network situation.
By focusing on only the active part of the supply, the True Mean Price sidesteps this issue. Its value is currently $82,000, which is around where BTC found its recent low. “This could be the new line in the sand we are hammering out,” noted the analyst.
BTC PriceBitcoin has shown a sharp jump during the past day that has taken its price back above $90,000.
Why this matters
This bitcoin story adds another data point to the current market tape and is useful when read alongside nearby source coverage.
Original source
Read on NewsBTCRelated market context

China Crypto Strategy Expands as Beijing Backs National Blockchain Network
China announced crypto plans for a national blockchain network. The proposal appeared in a policy document from the Communist Part...

SUI Crypto Up +2% Following $30M DATA Network Investment
SUI crypto trades at $1.12, up +2.2% over 24 hours, as traders weigh a sharp recent rebound against overhead resistance. The Sui F...

Aave’s USDG rollover plan has a yield below most quoted borrowing rates
Aave’s proposed USDG rollover would let borrowers carry their stablecoin debt into a new fixed-yield USDG position, but the replac...

Bitfinex ETH longs climb to their highest level in over four years
The surge in Bitfinex ETH longs suggests heightened market optimism, but it also raises the risk of a long squeeze if prices decli...
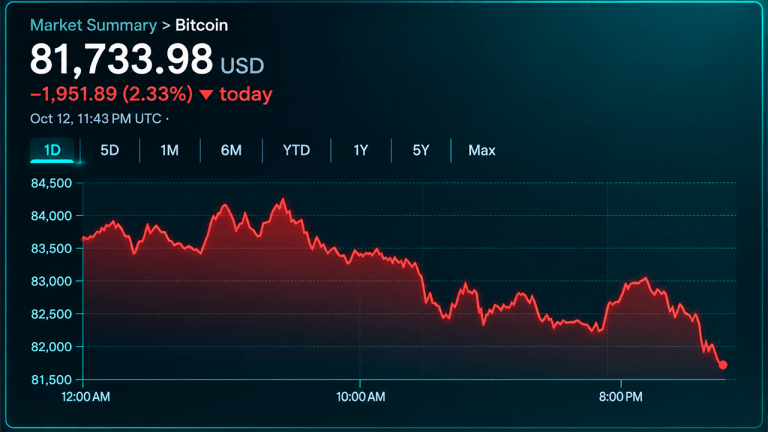
Bitcoin Price Falls Below $82K as $406M in Longs Get Liquidated
Bitcoin cracked below $82,000 Monday evening, setting off another painful reckoning for leveraged crypto traders. Nearly $489 mill...

Bitcoin falls below $82,000 as $120 million in crypto longs get liquidated
The rapid liquidation highlights the volatility and risks of leveraged trading, potentially deterring cautious investors and impac...