BTC price chart seen mirroring US spot Bitcoin ETF launch pattern
Bitcoin’s price chart looks similar to when spot Bitcoin ETFs were launched in the United States — suggesting a breakout soon, though there are some differences this time around.
Archive context
Older archive item. Useful for background and entity history, but not a fresh market-moving signal.

Bitcoin’s price chart looks similar to when spot Bitcoin ETFs were launched in the United States — suggesting a breakout soon, though there are some differences this time around.
Why this matters
This bitcoin story adds another data point to the current market tape and is useful when read alongside nearby source coverage.
Original source
Read on CointelegraphRelated market context

US spot bitcoin ETFs see $266M inflow, largest since May
Renewed institutional interest in Bitcoin ETFs may signal a shift in market sentiment, potentially influencing future Bitcoin pric...

Bitcoin needs trillions to go parabolic again as ETF demand fades
Bitcoin’s next major rally may depend less on whether investors still believe in the asset than on whether enough large balance sh...

Tether’s Alloy Launch Shows Stablecoins Are Moving Beyond Plain Dollars
Tether has launched Alloy, a synthetic dollar product backed by Tether Gold, in a move that pushes the stablecoin issuer further b...

BlackRock put $209M behind Bitcoin’s rebound but can it last?
U.S. spot Bitcoin ETFs turned positive again on July 6, and the clearest question for Bitcoin is whether BlackRock's IBIT provided...

Ondo launches equity perps with tokenized stocks as collateral
Ondo Perps launched with up to 20x leverage, tokenized stocks as collateral, 24 hour trading and up to $3 million in rewards. The...
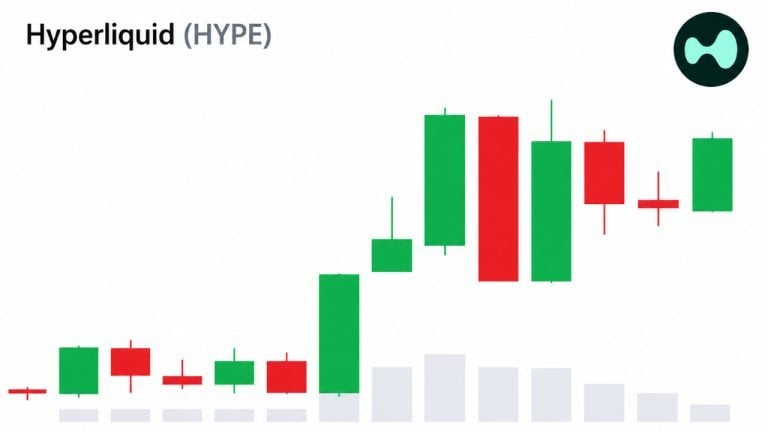
Hyperliquid Stays Near All-Time High, Even as Bitcoin ETFs Lose $6.5 Billion
Even as billions of dollars exit major crypto investment products, Hyperliquid’s HYPE token has remained resilient despite heavy w...