BTC Trapped In Tight Range: Liquidity Heatmap Shows Key Price Points At $115K, 106K
Bitcoin price struggled to establish a stable direction in the past week, as intense levels of volatility continue to rock the market. Following two weeks of market correction, the premier cryptocurrency attempted a pric...
Archive context
Older archive item. Useful for background and entity history, but not a fresh market-moving signal.

Bitcoin price struggled to establish a stable direction in the past week, as intense levels of volatility continue to rock the market. Following two weeks of market correction, the premier cryptocurrency attempted a price rebound, reaching around $112,000 before retracing to $107,000 price zone.
Presently, Bitcoin trades in the $111,000 price range after some steady gains in the past 48 hours. Interestingly, a popular analyst with the X username DaanCrypto has identified an insightful trend amidst this market uncertainty.
Sideways Bitcoin Market Sets Stage For Explosive Move As Liquidity BuildsIn a post on Friday, DaanCrypto shared an important on-chain development of the Bitcoin market following the highly volatile price moves in October 2025. Despite the consistent price swings, the analyst explains that BTC has remained locked in a local price range over the past two weeks, with its present price hovering above the midpoint of this structure.
This sideways action has been driven by buyers and sellers repeatedly foiling each other’s attempts to break out, thereby preventing the asset from establishing a decisive breakout pattern. Amid the continuous consolidation, untriggered liquidation levels are accumulating just above and below the local price range.
This pattern is typical of Bitcoin’s pre-breakout phases. DaanCrypto explains that the longer the price consolidates within a tight corridor, the more liquidity pools build up outside it. Notably, when price eventually sweeps these clusters, it often triggers a cascade of liquidations and stop orders, which fuel the next large price move.
Using data from Coinglass, DaanCrypto has identified $106,000 as a level with the heaviest concentration of long liquidations. Therefore, this price point functions as a critical support zone, and a downward wick below which could trigger selling forces pushing Bitcoin to deeper levels.
Meanwhile, the $115,000 region holds a thick short-side liquidity, meaning a push above this threshold could fuel a rapid short squeeze and propel BTC to higher levels, perhaps beyond its current all-time high at $126,210.
Bitcoin Still On For A Comeback?In contrast to popular sentiments of an “Uptober” and blooming Q4, Bitcoin has failed to achieve a sustainable price growth in October. A report from the Bitcoin Archive states that the crypto asset’s return in Q4 2025 is now estimated at -2.84%. This figure shows an extreme underperformance as Bitcoin’s average Q4 is valued at 74.77%.
However, with over 60 days remaining until the end of 2025, there is still ample time for the premier cryptocurrency to pull off a market recovery. After the CPI data met expectations, the chances of an interest rate cut have increased, and an eventual announcement by the Federal Reserve could perhaps trigger Bitcoin’s rebound, among other factors.
At press time, Bitcoin continues to trade at $111,424, reflecting a 3.91% gain in the past seven days.
Featured image from iStock, chart from Tradingview
Why this matters
This bitcoin story adds another data point to the current market tape and is useful when read alongside nearby source coverage.
Original source
Read on NewsBTCRelated market context

XRP Price Today: XRP Hits $1.60 as Heavy Whale Accumulation Points to a $2 Rally and Beyond
The XRP price reached $1.6060 on September 23 after opening near $1.5808, according to historical market data. The token subsequen...

Bitcoin Recoils Below $86,000: Is Bitcoin Price Prediction Still Shooting For $90,000?
Bitcoin Price Prediction: Bitcoin (BTC) trades at $85,954, down a modest 0.3% on the day, holding the upper band of a rebound that...

$1 billion in trading volume masks hidden liquidity risks for Coinbase stock token holders
More than $1 billion in reported trading makes Coinbase's stock tokens look active. For a holder looking to sell, the question is...

Can Ripple Crack $1.80? XRP Price Prediction Says This Week
XRP Price Prediction: Ripple (XRP) trades at $1.59 as of this writing, up 1.6% on the day, with a 24-hour range spanning $1.5577 t...
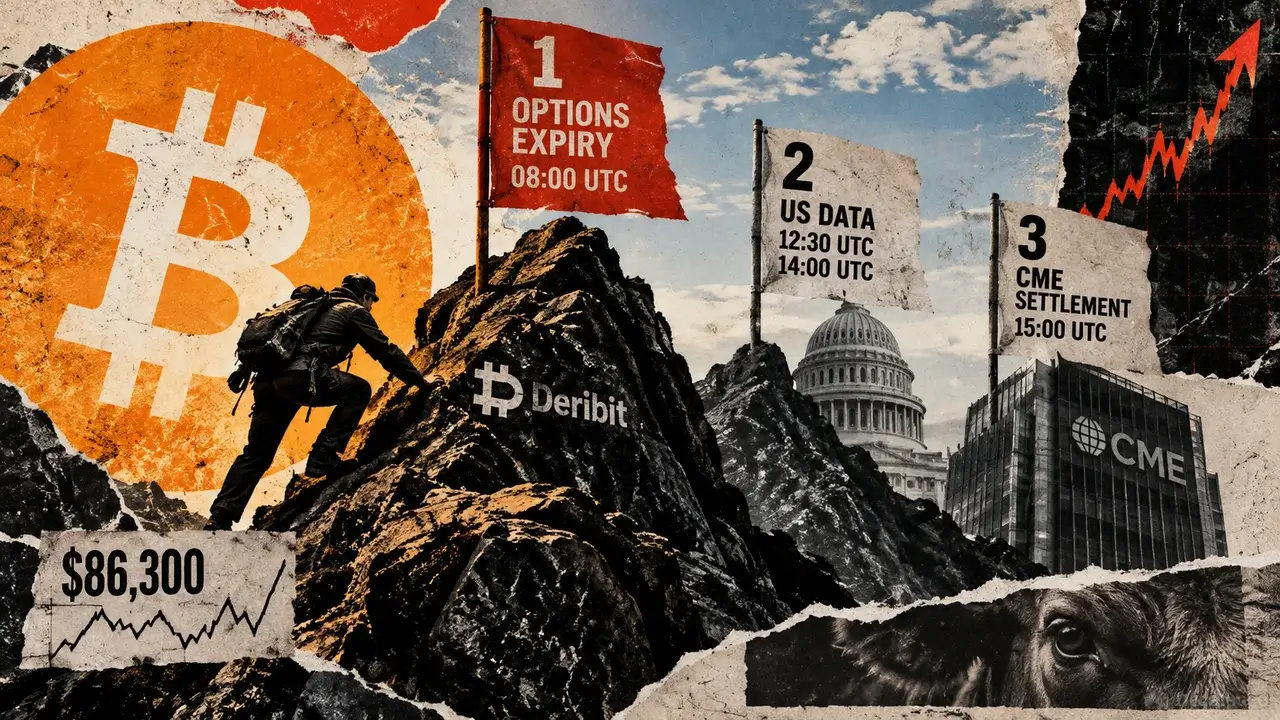
Bitcoin faces $16 billion options expiry Friday, then two more tests hit the rally
Bitcoin options carrying roughly $16 billion in notional value expire on Deribit at 08:00 UTC on Friday, Sept. 25. Calls account f...

Massive ETF capital exits threaten Bitcoin’s fragile $86,000 price surge
Bitcoin’s 11.65% weekly rebound now carries evidence of genuine spot and on-chain participation, widening a move that began with h...