Buying Bitcoin Now Is Like Getting It Below $10,000 In 2019: Experts
Bitcoin is weaving through a consolidation phase since marking a new all-time high of $73,777 in mid-March. Since then, Bitcoin’s daily closing prices have exhibited significant restraint, never sealing above $71,500 and...
Archive context
Older archive item. Useful for background and entity history, but not a fresh market-moving signal.

Bitcoin is weaving through a consolidation phase since marking a new all-time high of $73,777 in mid-March. Since then, Bitcoin’s daily closing prices have exhibited significant restraint, never sealing above $71,500 and maintaining a floor above $54,000, though it has seen a major intraday low touching $49,000. This consolidation phase has nudged the Fear and Greed Index towards a cautious “fear” score of 30, revealing an atmosphere of apprehension amongst traders who find themselves frequently whipsawed by the volatile market dynamics.
Is $60,000 The New $10,000 For Bitcoin Price?Despite the prevailing market nerves, some market experts believe that this is a potential buying opportunity, reminiscent of similar market conditions seen in 2019. Bloomberg ETF expert James Seyffart remarked via X: “Bitcoin right now around $50k-$70k over the last 6 months kinda sorta reminds of BTC trading around $7k – $10k from mid 2019 through early to mid 2020.”
He acknowledges the complexities of comparing historical and current charts, emphasizing that while historical patterns should not dictate future outcomes, the comparative dynamics offer insightful parallels. “I obviously know not to equate historical charts with current charts. i know all the differences of the current price dynamics etc. $10k was way further off the $20k+ ATH that 60K is. But go ahead — make fun of me. I can take it,” Seyffart added.
James “Checkmate” Check, a leading on-chain analyst and co-founder of Checkonchain, concurred with Seyffart’s observation. “The similarities between the 2024 chop-consolidation, and the one we experienced back in 2019 are strange, and uncanny.”
In 2019, the market notably surged from $4,000 to $14,000 within three months, significantly driven by the PlusToken Ponzi scheme in China, which absorbed approximately 2% of Bitcoin’s total circulating supply at the time. This was followed by a mass sell-off of these acquired coins on Huobi by the Chinese CCP, contributing to prolonged market choppiness until the sharp downturn in March 2020.
Drawing a parallel, Check noted that a similar sequence unfolded in 2024 when the market climbed from $40,000 to $73,777, catalyzed by a substantial uptake in spot bids from US spot ETFs, absorbing around 5% of the Bitcoin supply. This was succeeded by substantial selling activities from the US and German governments, involving approximately 70,000 BTC, which contributed to sustained market chop until the 5-August Yen Carry Trade unwind.
“Seriously, it is truly bizarre how similar these events are, and this is just based on the headline events. There is even more evidence below the surface,” Check concluded. He shared several on-chain metrics which highlight the strong similarities.
His “Supply Overheads During 2024 Chop-consolidation” chart showed that the 6-month sum of spent coins older than 1 year was quite similar to historical movements. In 2019, 1.75 million BTC was moved by this cohort; comparably, in 2024, as of today, 1.9 million BTC has been mobilized. Noteworthy, the large entities, including the Grayscale Bitcoin Trust (GBTC), German Government, and the US government, accounted for about 454,000 BTC of this movement.
Additional data from Check’s analysis highlighted the “Realized Profits” during these periods. In 2019, 3.4 million BTC were sold for profit over six months. In 2024, this figure stands at 3.33 million BTC.
However, the analysis of realized losses provides a stark contrast between the two periods. In 2019, losses equaled 30% of the profits, indicating a market fraught with investor fear and readiness to sell at losses. Conversely, in 2024, losses are only 10% of the profits. This comparison demonstrates how market sentiment has shifted from 2019 to 2024, with investors in 2024 appearing more confident and less prone to panic selling.
At press time, BTC traded at $59,689.
Why this matters
This bitcoin story adds another data point to the current market tape and is useful when read alongside nearby source coverage.
Original source
Read on NewsBTCRelated market context

Payments Firm Says Tether Froze $2.76 Million Brazilian Police Didn’t Flag, Forcing Layoffs
Tether froze $2.76 million of a payments company’s working capital though the Brazilian police investigation behind the freeze nev...

Pudgy Penguins Owner Is Shutting Down Its Abstract Chain, Where $47 Million Still Sits
Abstract, the Ethereum layer 2 that Pudgy Penguins parent Igloo Inc. built to bring everyday users onchain, will shut down on Dec....

Unknown whale moves approximately 133.78 million USDC to Aave
The large USDC movements into Aave highlight the growing influence of anonymous capital flows in DeFi, impacting liquidity dynamic...

Founders Fund leads $5 million token purchase in Anvil protocol
Founders Fund's investment in Anvil highlights the growing integration of traditional finance with DeFi, impacting governance and...

Imperial reportedly raises $1.5 million seed round for Solana perps platform
Imperial's potential funding shift could redefine Solana perps trading dynamics, impacting liquidity, competition, and transparenc...
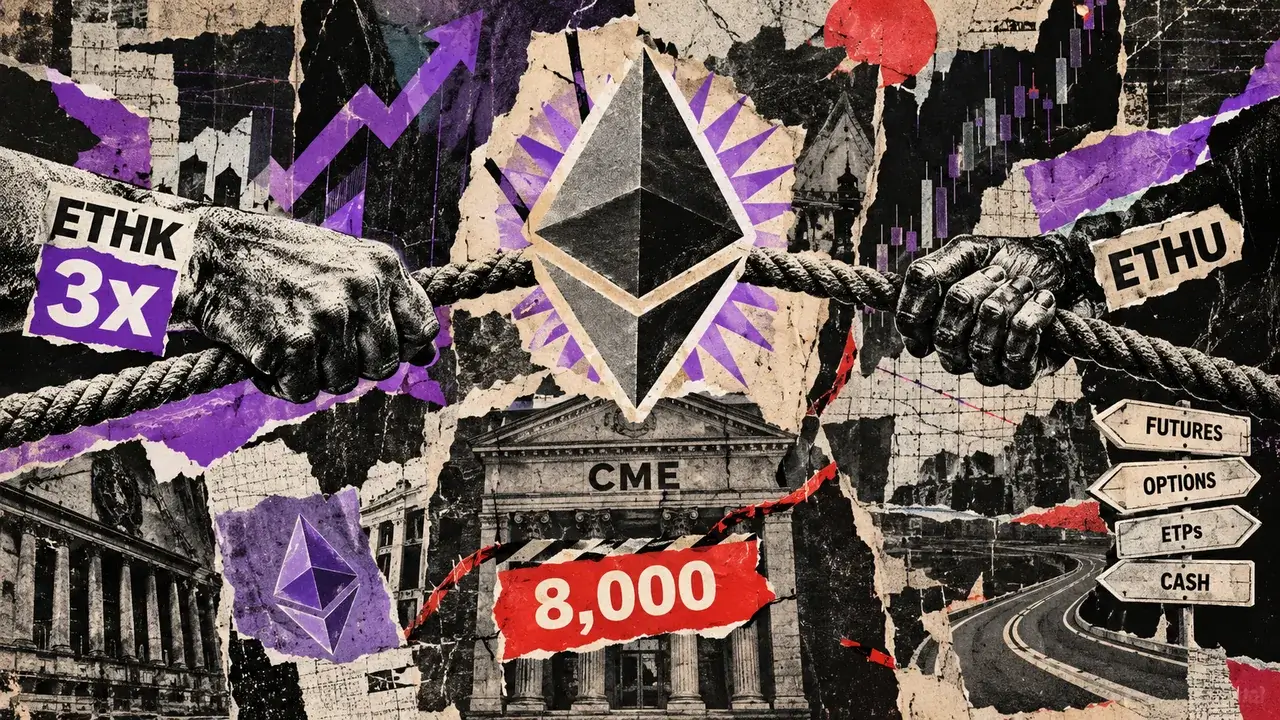
Ethereum’s proposed 3x ETF could reach CME’s futures threshold with just $362 million
At ETHU's Oct. 6 disclosed futures valuation, a 3x Ethereum ETF with $362.1 million in assets would target about $1.09 billion of...