Can Bitcoin Withstand Continued Dollar Strength? | BTCUSD September 22, 2022
In this episode of NewsBTC’s daily technical analysis videos, we examine yesterday’s perfected TD9 buy setup in Bitcoin and other potentially bullish signals. We also compare BTC against the dollar using the DXY Dollar C...
Archive context
Older archive item. Useful for background and entity history, but not a fresh market-moving signal.

In this episode of NewsBTC’s daily technical analysis videos, we examine yesterday’s perfected TD9 buy setup in Bitcoin and other potentially bullish signals. We also compare BTC against the dollar using the DXY Dollar Currency Index.
Take a look at the video below:
VIDEO: Bitcoin Price Analysis (BTCUSD): September 22, 2022In yesterday’s video, we warned of a new low being made due to the appearance of a TD9 buy setup. These signals can be perfected when the candle makes a lower low. Here is how that played out.
Market Timing Tool Triggers Perfect Buy Setup During FOMC AftermathGiven the several shakeouts and the explosive intraday volatility, taking a position based on the the TD9 buy setup was not easy. The TD Sequential has also brought its resistance level down to roughly $22,700. If price can tag the red line, we could have a low timeframe reversal.
A bullish divergence on the Relative Strength Index and LMACD potentially back up this bullish signal.
Were bulls bold enough to take action at the TD9 buy setup? | Source: BTCUSD on TradingView.com Building The Case For A Possible Bitcoin Bear Market BottomMomentum is also right on the zero line on weekly timeframes, where those same bullish divergences could be building. The doji candle is indicative of indecision in the market, and could be a pause prior to a reversal, or strong continuation to the downside.
Weekly momentum has also fallen to the same level where past reversals formed. A bullish crossover might be all it takes to confirm a bottom is already in. In 2018, once crossed, Bitcoin took off like a rocket with more than 300% ROI in three months.
Comparing former bear market bottoms using the Relative Strength Index, each time the indicator reached oversold conditions on weekly timeframes, the bottom was already in. The PPO Percentile Rank which helps find tops and bottoms, shows that Bitcoin has been exhibiting bottom-like behavior. Moving out from the green range often has been the start of a new bull run.
Several indicators could suggest the bottom is in | Source: BTCUSD on TradingView.comRelated Reading: When Will Crypto Winter Thaw Out? Total Crypto Market Cap (TOTAL) September 20, 2022
BTC Versus USD: It All Comes Down To The DollarWhat happens to Bitcoin at this point has more to do with the dollar. The dollar is one half of the BTCUSD trading pair, making it especially important.
The dollar has been in a powerful uptrend, as you can see in the daily chart. However, momentum has been making lower highs suggesting that the underlying strength is weakening.
The DXY dollar currency index is also potentially forming an ending diagonal, which looks much like a rising wedge. These potentially bearish signals could create a reversal in the dollar that allows Bitcoin to bounce.
A comparison with Bitcoin offers a potential example of what might happen in the dollar. After a failed upthrust, price action reversed and a high was put in.
Is the DXY forming an ending diagonal? | Source: BTCUSD on TradingView.comLearn crypto technical analysis yourself with the NewsBTC Trading Course. Click here to access the free educational program.
Follow @TonySpilotroBTC on Twitter or join the TonyTradesBTC Telegram for exclusive daily market insights and technical analysis education. Please note: Content is educational and should not be considered investment advice.
Featured image from iStockPhoto, Charts from TradingView.comWhy this matters
This bitcoin story adds another data point to the current market tape and is useful when read alongside nearby source coverage.
Original source
Read on NewsBTCRelated market context
Bitcoin’s Fed Week Starts With A Fresh Rise In US Inflation Expectations
TL;DR: US household inflation expectations rose in October while consumer sentiment barely changed. The readings add context ahead...

JPMorgan Solana Push Brings MONY and JLTXX Into Tokenized Finance
JPMorgan Asset Management brings two Solana tokenized money market funds, MONY and JLTXX, to the blockchain, opening another route...
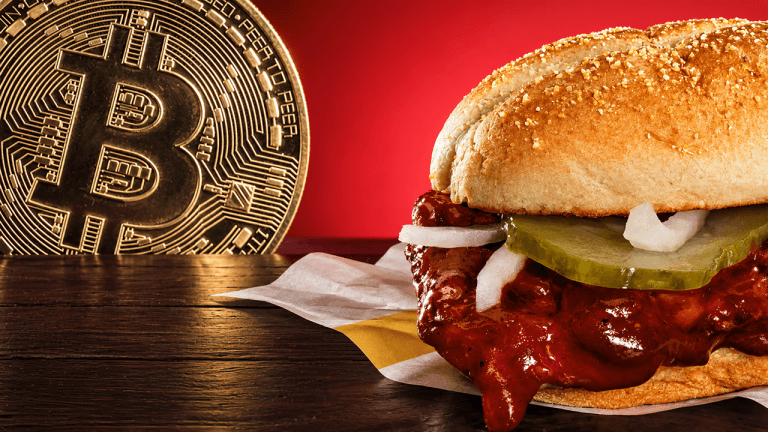
McRib Is Back, and Bitcoin’s Weirdest Bullish Indicator Lives On
Crypto proponents are once again entertaining the curious connection between McDonald’s McRib and bitcoin prices, as the fast-food...

Ethereum (ETH) Price Prediction: Whale Rotates $155M Into ETH as Longs Surge Near $2,500
Ethereum is trying to stabilize after another volatile stretch, with price returning toward the mid-$2,400 region while several po...
Bitdeer Reports 1,355 Bitcoin Mined In September While Building AI Capacity
TL;DR: Bitdeer says its September Bitcoin production reached 1,355 BTC, highlighting the miner’s expanding hash rate alongside sep...

HSBC Launches First Stablecoin, Bringing Hong Kong Dollar Payments to 3.3M Users
HSBC has launched its first stablecoin, a Hong Kong dollar-backed digital currency designed for everyday payments, marking a signi...