Covering Bitcoin's Spot And Derivatives Market Dynamics
What do the futures perpetual funding rate and long-term holder position change tell us about the bitcoin price?The below is from a recent edition of the Deep Dive, Bitcoin Magazine's premium markets newsletter. To be am...
What do the futures perpetual funding rate and long-term holder position change tell us about the bitcoin price?
The below is from a recent edition of the Deep Dive, Bitcoin Magazine's premium markets newsletter. To be among the first to receive these insights and other on-chain bitcoin market analysis straight to your inbox, subscribe now.
In today’s Daily Dive, we’re covering some visuals to illustrate bitcoin’s spot and derivatives market dynamics. We can do this by looking at two key metrics compared to price: the futures perpetual funding rate and the long-term holder net position change.
As a refresher, the futures perpetual funding rate was covered more in-depth in The Daily Dive #097 - Derivatives Market Breakdown. It’s a key rate to watch, especially when the market is overleveraged to one side with the derivatives market having more influence over the short-term price.
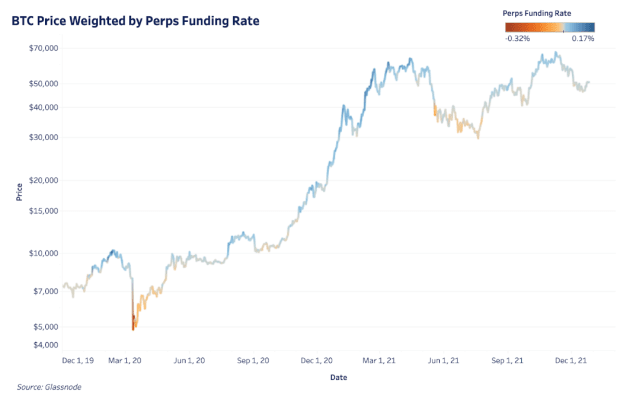
The two charts below show bitcoin price overlaid with the perpetual funding rate. Since the market is historically biased long, the color thresholds are lowered in the second chart to better emphasize periods of any negative funding. Overall, the charts show when the derivatives market is either inflating or suppressing price.
The bitcoin price weighted by the perpetual funding rate.The dark blue areas show when the market was overleveraged to the long side and the dark red areas show the opposite. Each of these extreme periods come with subsequent, explosive moves in price as positions are wiped out.
The dark blue areas show when the market was overleveraged to the long side and the dark red areas show the opposite.The derivatives market influences price in the short term but long-term price is driven by adoption, sustained spot demand and the behavior of long-term holders. The long-term holder net position change is one way to view this behavior as it’s the 30-day change in supply held by long-term holders.
As we’ve covered before, every bitcoin price all-time high comes with a significant distribution of coins from long-term holders to new market entrants. Periods of dark red show this in the below chart while periods of dark blue show relatively heavy accumulation periods over bitcoin’s lifetime.
Bitcoin price weighted by the long-term holder net position change.Original source
Read on Bitcoin MagazineRelated market context

Crypto exchanges are opening a two-front war for the stock market
Binance, Kraken, Bybit, and Gemini are moving to add US stocks and ETFs to their crypto trading apps, making a direct play for the...
Strategy Stock MSTR Offers Bitcoin Exposure At 18% Discount
Bitcoin Magazine Strategy Stock MSTR Offers Bitcoin Exposure At 18% Discount I’ve been vocal about accumulating Bitcoin aggressive...

Bitcoin price faces new risk as big buyers lose conviction
Bitcoin’s largest buyers are no longer behaving like a reliable backstop for the largest cryptocurrency. The exchange-traded funds...

SpaceX Officially Joins Public Bitcoin Leaderboard as 8th Largest Holder With 18,712 BTC
Bitcoin Magazine SpaceX Officially Joins Public Bitcoin Leaderboard as 8th Largest Holder With 18,712 BTC Elon Musk’s SpaceX launc...

SpaceX to debut on stock exchange, positioning Elon Musk for trillionaire status
SpaceX's IPO could redefine market dynamics, influencing tech investment trends and potentially impacting cryptocurrency market se...

JPMorgan Says the Debasement Trade Retreat Has ‘Accelerated’ for Bitcoin as June ETF Outflows Reach $2.1 Billion
The debasement trade that fueled demand for bitcoin and gold through much of this year is unwinding, and the retreat has accelerat...