Dollar Wrecking Ball, Good or Bad for Bitcoin?
The below is an excerpt from a recent edition of Bitcoin Magazine Pro, Bitcoin Magazine's premium markets newsletter. To be among the first to receive these insights and other on-chain bitcoin market analysis straight to...
Archive context
Older archive item. Useful for background and entity history, but not a fresh market-moving signal.

The below is an excerpt from a recent edition of Bitcoin Magazine Pro, Bitcoin Magazine's premium markets newsletter. To be among the first to receive these insights and other on-chain bitcoin market analysis straight to your inbox, subscribe now.
Bitcoin Building Massive Support RangeBitcoin is stuck between strong support and resistance. Breaking out of this range, up or down, will be difficult, minus a surprise ETF approval. While we’ve been in this range for six months, fundamentals have continued to improve. For instance, the number of bitcoin addresses with >1 btc continues to grow, nearly 30% of bitcoin’s supply hasn’t moved in 5+ years, asset allocators with a total of >$17 trillion in assets under management have applied for bitcoin spot ETFs, bitcoin continues to come off exchanges, and the halving is coming. Price will eventually break the resistance and this range will then become massive support.
On the daily chart below, we see $25,000 held firm as resistance becomes support. This week price is attempting to break out from under the 200-day moving average.
Bitcoin’s daily Relative Strength Index (RSI), an extremely popular momentum indicator, is safely above the 50-level midline which is a required sign to start a new bullish trend. Also, the Moving Average Convergence Divergence (MACD) has managed to stay above the signal line in a bullish stance. Importantly, both these widely used indicators are in bullish agreement for the first time since June.
Note on technical analysis: It is our view that technical analysis is a series of Schelling points. These are prices or indicators “people tend to choose by default in the absence of communication.” Meaning, they are things on the chart traders and investors are watching.
The Dollar Rally: Good or Bad News for Bitcoin?The dollar wrecking ball is threatening to come back. The dollar index (DXY) broke out of its downward trend in mid-August, back-tested and is currently rallying into the 38.2 fib retracement level. This is a strong move contrary to the almost universal bearish dollar thesis, but has now reached a logical place for consolidation.
It is not surprising that the dollar is rallying as recessions in Europe and China are squeezing the market’s ability to service existing dollar debt or access new dollar debt. In this environment, we should also expect interest rates to fall as money moves into more safe and liquid assets.
US Treasury yields can’t defy the strong move in the dollar for long. Milton Friedman’s Interest Rate Fallacy tells us that rates fall as money is tight, not loose. The dollar rising is a rock solid indication that money is tight, therefore, we should expect rates to fall.
Typically, a strong dollar is seen as negative for bitcoin, but in bitcoin’s history the correlation coefficient with the Dollar Index (DXY) has been positive many times. In 2016, it even reached 0.93. In fact, prior to COVID, it could be argued, bitcoin and DXY were as often positively correlated as not.
The Correlation Coefficient does tend to be more negative than positive in recent years, however, in bull market breakouts it usually swings positive. For instance, 2016 was dominated by a relatively positive correlation as the bull market was getting started. Then, again in the first half of 2019, as bitcoin entered an early bull market before COVID, it was positively correlated with DXY.
The negative correlation only begins to dominate after March 2020, coinciding with a high Consumer Price Index (CPI). This is particularly interesting because Bitcoin’s fixed supply is a hedge against inflation. No-coiners have pounced on this mismatch, during high CPI bitcoin performed badly. The explanation is easy but uncomfortable for most bitcoiners, CPI acceleration came, not from inflation (money printing) but mainly from supply chain disruptions and artificially stimulated demand from fiscal spending.
FOMC Meeting PreviewThe Federal Open Market Committee (FOMC) is meeting this week and it is a safe bet that they will pause. They do not like to surprise the market, and the market is in universal agreement of no hike. The Fed Rate Monitor Tool on Investing.com is a good place to bookmark. It uses Fed Funds futures to imply what the market thinks.
Source: Investing.com
The Fed Fund futures curve has started to move upward for next year, meaning the market is pricing in fewer cuts, but not moving significantly higher on the short end. This tells us the market thinks the Fed is most likely done, and rate cuts will start sometime next year.
The curve is slowly moving higher, pricing in later and later cuts to the Fed Funds target range.
Source: Forexlive.com
According to the Fed Rate Monitor Tool, a cut to 500-525 basis points (bps) becomes the most likely scenario by June 2024, and by the November 2024 FOMC meeting (US election time), the Fed Funds target will be 450-475 bps, so 3 cuts.
Surprisingly, the markets are in agreement with the Fed’s own dot plots. Neither see a recession but do imply a slow down coming. This is a serious signal and should be considered the base case as of now. That is bullish for risk assets including bitcoin through the halving season.
Source: Federal Reserve
However, we know the Fed never sees a recession coming, and tends to react rapidly when it arrives. Take Chairman Powell’s 2019 pivot. Rates were naturally falling implying money was getting tighter. He responded with three sympathetic cuts, but when COVID hit he slashed to zero. That same pattern seems to be implied by the futures market.
When the financial system seizes up, the Fed will be forced to slash rates. These events tend to congregate around the end of Q3 and Q1. For example, the banking crisis this year was around the end of Q1. We have some evidence that recession in the US will be avoided out to Q3 of 2024, leaving bitcoin time to run through the halving and a likely spot ETF approval.
*Note: Past performance does not guarantee future results. This article is not intended as financial advice.
Why this matters
This bitcoin story adds another data point to the current market tape and is useful when read alongside nearby source coverage.
Original source
Read on Bitcoin MagazineRelated market context

Bitcoin Posts Best Quarter Since 2024 as ETF Inflows Reach $6.34 Billion
Bitcoin ended the third quarter with its strongest quarterly performance since the final three months of 2024, as renewed demand f...
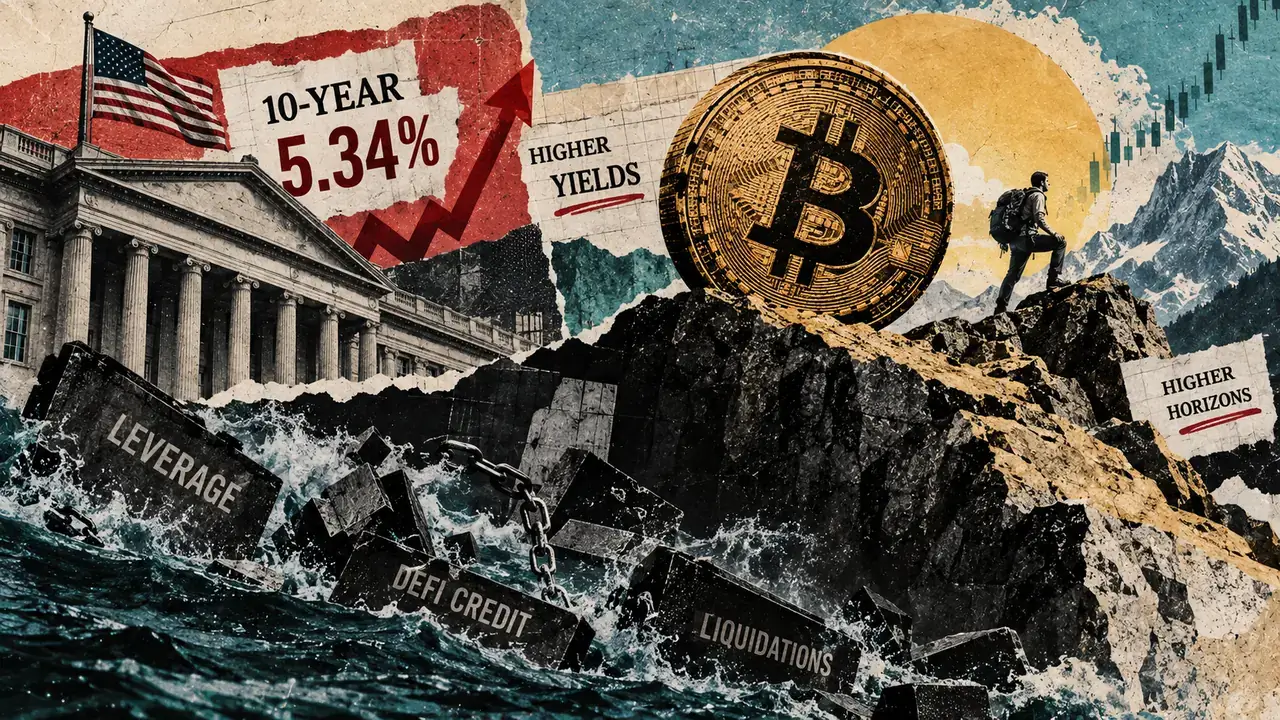
Bitcoin survived 5% yields but crypto’s cheap-money era did not
The US 10-year Treasury yield touched 5.34% on Oct. 1, its highest since 2002, capping a third quarter in which it climbed almost...

Ethereum Foundation Launches Privacy Tool That Cuts the Link Between AI Prompts and Payers
The Ethereum Foundation has launched zkAPI, a system for paying for AI models and other metered online services without that usage...
Coinbase will support the AERO and VELO token migration from November 2 to 4, 2026
The token migration could streamline DeFi operations, enhancing liquidity and governance across multiple blockchain networks. The...

Bitcoin (BTC) Price Today: 2028 Halving Cycle and BlackRock ETF Inflow Signal Long-Term Rally
Recent market data also show that Bitcoin buyers have absorbed a key sell wall around $85,000, reducing one source of near-term re...
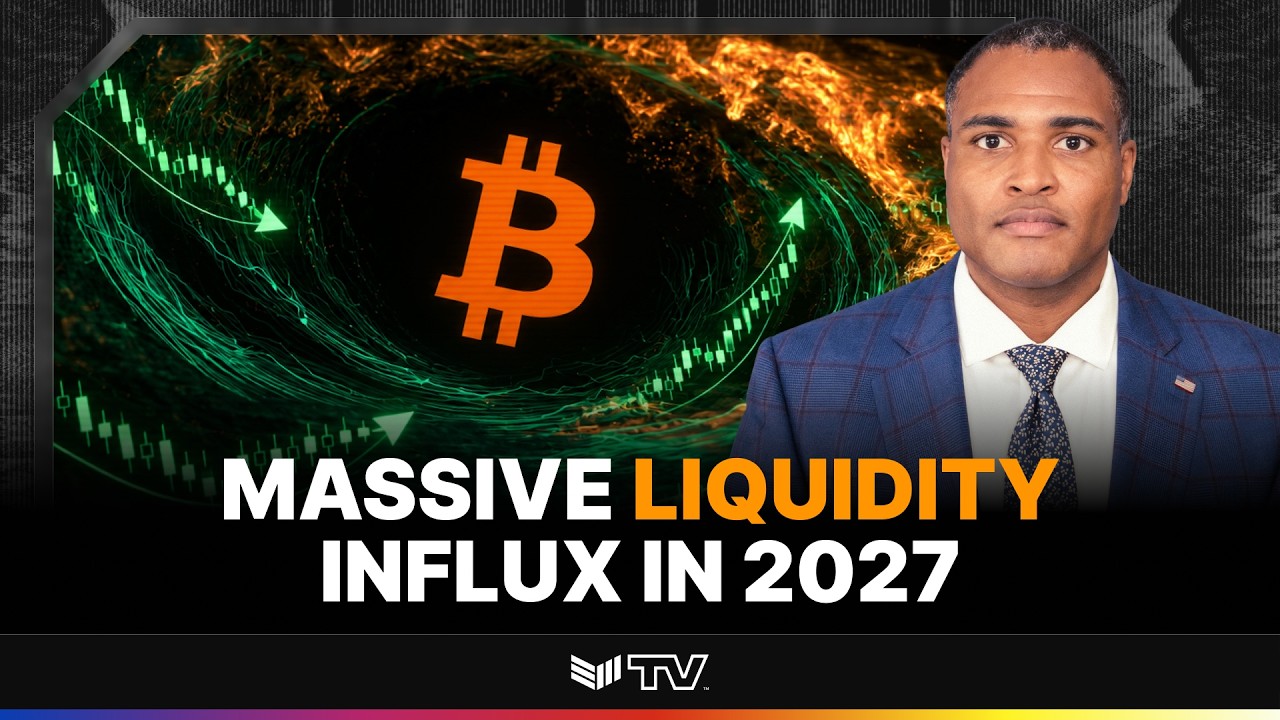
Darius Dale: Will Global Liquidity Send Bitcoin Higher in 2027?
Bitcoin Magazine Darius Dale: Will Global Liquidity Send Bitcoin Higher in 2027? Are we headed for a period of chop before a bigge...