Dormant Bitcoin Moves Align With Recent Price Reactions: 7,547 BTC Awakens
Bitcoin (BTC) is trading in a sideways consolidation phase after hitting its all-time high near $124,000, with volatility keeping investors cautious. The price has been fluctuating in a relatively tight range, showing re...
Archive context
Older archive item. Useful for background and entity history, but not a fresh market-moving signal.

Bitcoin (BTC) is trading in a sideways consolidation phase after hitting its all-time high near $124,000, with volatility keeping investors cautious. The price has been fluctuating in a relatively tight range, showing resilience but also failing to establish a clear directional trend. For many traders, this period feels like the calm before a potential breakout, as the market sits at what analysts describe as a pivotal setting.
While short-term traders navigate intraday moves, long-term investors are focusing on structural signals that could define Bitcoin’s next phase. Top analyst Maartunn recently highlighted a significant on-chain dynamic: dormant whale coins are increasingly moving, and these transfers appear closely connected to recent price swings. Historically, such movements have often preceded stronger market reactions, either reinforcing bullish momentum or triggering corrective phases.
This alignment between dormant whale activity and price volatility is fueling speculation that a decisive move may be imminent. With Bitcoin consolidating near critical levels, the coming days could set the tone for whether BTC attempts another push toward its highs or corrects further.
Dormant Bitcoin Movements Align With Fed DecisionAccording to onchain analyst Maartunn, a remarkable event just unfolded: 7,547 BTC aged between 3–5 years have moved onchain. This is no small occurrence, as coins of this age bracket are often considered firmly in the hands of long-term holders. Their sudden activity has historically acted as a precursor to major market moves. Maartunn emphasizes that investors should carefully note how this metric has consistently aligned with sharp price reactions in recent months.
In his analysis, Maartunn presents data showing that every time this specific group of dormant coins becomes active, the Bitcoin market reacts with significant volatility. These swings can be bullish or bearish, but the common denominator is that they rarely go unnoticed. Essentially, when whales who have held coins for several years begin moving them, it signals strategic repositioning that tends to ripple across the broader market.
This latest movement coincides with one of the most pivotal macroeconomic events of the year—the Federal Reserve’s interest rate decision, scheduled for this week. The Fed’s choice, whether to cut rates by 25bps or 50bps, will dictate investor sentiment across all risk assets. For Bitcoin, the timing of dormant whale activity could amplify the impact of this decision, potentially setting the stage for a massive price swing in the days ahead.
With BTC consolidating around $115K, the convergence of long-term whale moves and macroeconomic uncertainty underscores the fragility of the current market structure. Traders and investors alike are bracing for what could be the beginning of Bitcoin’s next decisive trend, fueled by both on-chain signals and global monetary policy.
Technical Analysis: Testing Resistance LevelsThe 4-hour chart shows Bitcoin consolidating around $115,555, with the price holding above both the 50-day and 100-day moving averages, currently at $114,341 and $112,378, respectively. This setup indicates short-term bullish momentum, as BTC managed to defend higher lows after its September rebound.
The next major resistance lies near $116,000, where sellers are actively defending. A breakout above this zone could open the path toward the key $123,217 resistance, last tested in mid-August. However, repeated failures to clear $116K increase the risk of short-term exhaustion, especially with uncertainty ahead of tomorrow’s Fed rate decision.
On the downside, support is established around the $114,000 region, which aligns with the 50-day SMA. Losing this level could push BTC back toward $112,000, where both the 100-day SMA and prior demand clusters converge. As long as BTC holds above $112K, the broader structure remains constructive.
Featured image from Dall-E, chart from TradingView
Why this matters
This bitcoin story adds another data point to the current market tape and is useful when read alongside nearby source coverage.
Original source
Read on NewsBTCRelated market context

Mid-Sized Bitcoin Wallets Add 113,950 Bitcoin as Price Rally Nears Test
Wallets holding between 100 and 1,000 BTC have added 113,950 Bitcoin since July 15, lifting their combined holdings 2.22% to 5.24...

Solana moves Alpenglow into testnet as SOL nears January highs
Solana has begun rolling out Alpenglow on testnet, moving its planned blockchain consensus overhaul into a public testing environm...

ECB speeches seen impacting markets like policy moves; Bitcoin eyes volatility
ECB's communication strategy may heighten market sensitivity, influencing financial stability and potentially increasing Bitcoin's...

Hyperliquid (HYPE) Price Prediction: Can Whale Buying and Binance Listing Drive HYPE to $210?
The technical setup for Hyperliquid price currently places $110, $130, $160, and $180 among the key levels to watch, while some tr...

Altcoin demand meets $18B threat as flows move into RWA perps as just 19% of traders keep alts
In the markets Talos tracked, daily volume in RWA perpetual futures tied to equities, commodities and indices rose from less than...
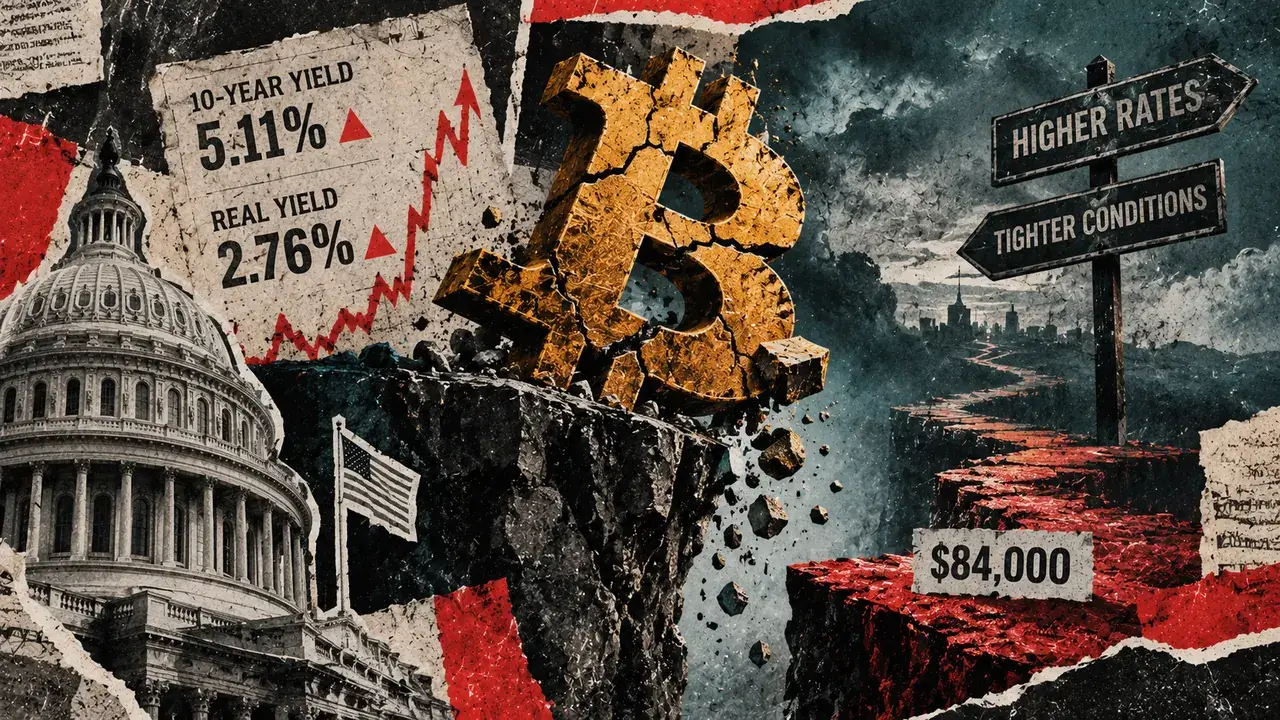
Why surging US real yields are quietly forcing Bitcoin under $84,000
Bitcoin registered an intraday low at $83,500 on Sept. 23, the same day the US 10-year Treasury yield closed at 5.11%, up 15 basis...