Expert Trader Shows ‘Simple Math’ To Calculate The Bitcoin Price Bottom
A crypto market analyst has outlined what he describes as a straightforward mathematical method that helped identify the bottom of Bitcoin’s previous bear market. By focusing on long-term Fibonacci levels and quarterly p...
Archive context
Older archive item. Useful for background and entity history, but not a fresh market-moving signal.

A crypto market analyst has outlined what he describes as a straightforward mathematical method that helped identify the bottom of Bitcoin’s previous bear market. By focusing on long-term Fibonacci levels and quarterly price behavior, the analyst argues that the same structural logic that marked the 2022 bottom is now shaping Bitcoin’s next macro phase.
Simple Math That Identified The Bitcoin Price Bear Market BottomIn an X post shared on March 8, crypto analyst Chetan Gurjar revisited a prediction he made in December 2022 regarding Bitcoin’s bear market low. While he acknowledged that the timing of the call was slightly off by a few months, he stated that the price target itself proved accurate.
The analysis referenced Bitcoin’s bear market bottom around the $15,000 region in late 2022, which the analyst had previously projected using this framework. His approach centers on macro Fibonacci extension levels plotted on the quarterly chart, with particular focus on the 1.618 Fibonacci level positioned near $62,084.
The chart accompanying the explanation highlights how Bitcoin historically reacts to this macro level. During the 2021 bull cycle, Bitcoin repeatedly failed to break and sustain price action above the 1.618 Fibonacci level. The analyst pointed to the second and fourth quarter candles of 2021, both of which were rejected at that same zone.
These repeated rejections signaled strong resistance at the time, reinforcing the significance of the level in the broader market structure. By mapping these macro levels across cycles, the analyst argues that long-term Fibonacci mathematics can help identify both extreme lows and potential expansion targets.
Quarterly Fibonacci Retest Suggests Next Macro PhaseThe analyst’s latest chart interpretation suggests that Bitcoin’s relationship with the 1.618 Fibonacci level has shifted from resistance to support. After breaking above the $62,084 region on the quarterly timeframe, Bitcoin has not produced a quarterly candle close below the level since the breakout.
The chart shows two notable retests following the move. In the second and third quarters afterward, Bitcoin briefly tested the level but managed to hold above it on a closing basis. One quarterly wick even dipped below $50,000 before reclaiming the $62,084 level. As of the current quarter ending in March, Bitcoin is again trading above the same macro Fibonacci level. According to the analyst’s interpretation, this behavior represents a bullish quarterly retest.
The projection drawn on the chart extends toward the next Fibonacci expansion level at 2.618, which sits near $393,874. Gurjar describes this level as the minimum macro target if the structure holds. The chart also signals potential volatility, suggesting price wicks could stretch toward the $500,000 region during the expansion phase.
However, the analyst notes that deeper quarterly wicks remain possible depending on broader market conditions, including potential weakness in the altcoin market. Even with that caveat, the framework presents the current structure as a continuation pattern centered on Bitcoin holding the 1.618 Fibonacci level.
Why this matters
Bitcoin is showing up inside the Macro & Rates theme, so this story is worth tracking for follow-through rather than treating it as a one-off headline.
Original source
Read on NewsBTCRelated market context

Bitcoin (BTC) Price Today: BTC Breaks $85K Resistance as Bulls Defend $80K Support
BTC traded around $85,311 in the technical analysis referenced for this report, while the broader market move also lifted Bitcoin...

Bitcoin Price Prediction: Has the BTC Bear Market Ended After 45 Weeks?
Bitcoin is trading at $81,600, up by a huge 6% since the start of last week, and the number that matters for its price prediction...

Perplexity AI Predicts Weak XRP Price by 2027: Bull Run Canceled?
The Silicon Valley-based Perplexity AI predicts XRP could have a tame Q4, saying it believes the token will only hit $3.25 by Janu...
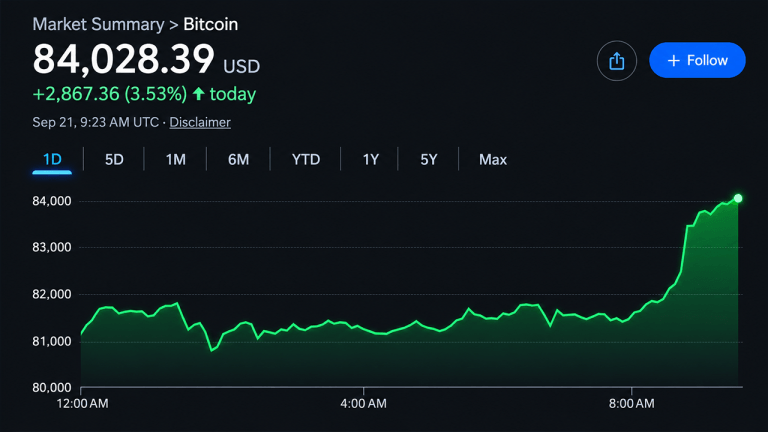
Bitcoin Price Crosses $84,000 as Analysts Declare Bear Market Over
Bitcoin’s price crossed the $84,000 mark early Monday morning after closing the week above its 50-week moving average for the firs...

Ethereum Price Prediction: Can ETH Break $3,000 This Month? Here’s Why It Could
Ethereum price is trading at $2,650, up by more than 3% on the day, after six consecutive green sessions dragged it out of a month...

Bitcoin shrugs off Fed hike and Clarity Act defeat, but analysts split on what comes next
Bitcoin held near $75,000 despite a Fed rate hike and the Senate's rejection of the Clarity Act. Analysts are split on the next mo...