Is Bitcoin Overheated? Key Signal Flashes Warning Similar To 2021 And 2024 Market Tops
Bitcoin is undergoing a sharp correction after losing the $115K support level, triggering a wave of uncertainty across the market. Following weeks of consolidation in a tight range, BTC has broken down, fueling debates a...
Archive context
Older archive item. Useful for background and entity history, but not a fresh market-moving signal.

Bitcoin is undergoing a sharp correction after losing the $115K support level, triggering a wave of uncertainty across the market. Following weeks of consolidation in a tight range, BTC has broken down, fueling debates among analysts about the asset’s short-term direction. Some experts warn that Bitcoin could face further declines as investors take profits and sentiment turns cautious. Others maintain a more optimistic view, suggesting that the correction is a healthy pause before BTC makes another attempt to reclaim its all-time highs.
Key data from CryptoQuant adds another layer to the analysis. Metrics indicate that Bitcoin is currently in an “overheated” state, with valuation indicators signaling excessive bullish momentum. This suggests that the current consolidation phase may extend further as the market works to reset. Until demand stabilizes and new liquidity flows in, Bitcoin could continue to trade in a volatile environment, with the $112K–$115K range acting as a critical battleground between bulls and bears.
With the Federal Reserve’s monetary policy and global macroeconomic factors still in play, Bitcoin’s next major move will likely depend on a combination of market sentiment, institutional demand, and the broader risk appetite of investors in the coming weeks.
Bitcoin Stock-to-Flow Model Signals OvervaluationTop analyst Darkfost recently shared insights on X, highlighting the significance of the Bitcoin Stock-to-Flow reversion (S2F) chart as a reliable indicator to assess Bitcoin’s valuation cycles. According to Darkfost, when the S2F metric rises above a value of 3, it typically indicates that Bitcoin is entering an overheated phase, signaling a high probability of a market correction. Currently, the S2F value is approaching this critical threshold, prompting Darkfost to caution investors that it may be an opportune moment to lock in profits before a deeper correction unfolds.
Darkfost’s analysis points to historical patterns where similar S2F readings have preceded substantial price declines. In September 2021, Bitcoin dropped from $63,500 to $30,800 after the S2F metric crossed into the overvaluation zone. Again, in November 2021, BTC crashed from $67,000 to $15,800 following a peak S2F signal. More recently, in March 2024, Bitcoin corrected sharply from $73,000 to $54,000 after entering overheated territory.
This preset alert system, designed for long-term market participants, serves as a strategic tool to help investors navigate Bitcoin’s volatile cycles. While the current correction might seem abrupt, Darkfost emphasizes that such pullbacks are essential for the market to reset and build a sustainable foundation for future growth. Investors are urged to remain cautious and monitor the S2F chart closely as Bitcoin navigates this critical phase.
BTC Struggles To Reclaim The $115K LevelBitcoin is attempting to recover after its recent decline, currently trading around $115,019 as shown in the 8-hour chart. The price has managed to bounce from the $112K support zone but faces strong resistance at the $115,724 level, which previously acted as a key support during the two-week consolidation range in July.
The 50-day and 100-day simple moving averages (SMAs) are now positioned just above the current price, adding to the overhead resistance. The 200-day SMA around $110,677 continues to provide solid support, keeping the overall uptrend intact for now. However, BTC must reclaim the $115,724 level and consolidate above it to regain bullish momentum.
Volume has been relatively low during the recent bounce, suggesting a lack of strong buying conviction. If Bitcoin fails to break above the $115K resistance decisively, it risks falling back to test the $112K zone again. On the upside, a successful breakout above $115,724 could open the path to retest the $122,077 all-time high resistance.
Featured image from Dall-E, chart from TradingView
Why this matters
This bitcoin story adds another data point to the current market tape and is useful when read alongside nearby source coverage.
Original source
Read on NewsBTCRelated market context

Microsoft Copilot AI Predicts Bitcoin Will Do Something Incredible in Q4 2026
Microsoft Copilot AI predicts a wild move for BTC in Q4 2026, calling it one of the strongest asymmetric risk-reward positions ava...

Anchorage Digital to support Bitcoin staking on Stacks for institutional investors
Anchorage's initiative may boost institutional Bitcoin engagement, potentially enhancing market sentiment and demand for BTC yield...

Hyperliquid (HYPE) Price Prediction: Can Whale Buying and Binance Listing Drive HYPE to $210?
The technical setup for Hyperliquid price currently places $110, $130, $160, and $180 among the key levels to watch, while some tr...

Crypto News Today: XRP, Dogecoin Signal Long-Term MVRV Discounts as Bitcoin Holds $82.5K Neckline
On-chain analytics firm Santiment reported that XRP’s 365-day Market Value to Realized Value (MVRV) stood at approximately -11.75%...
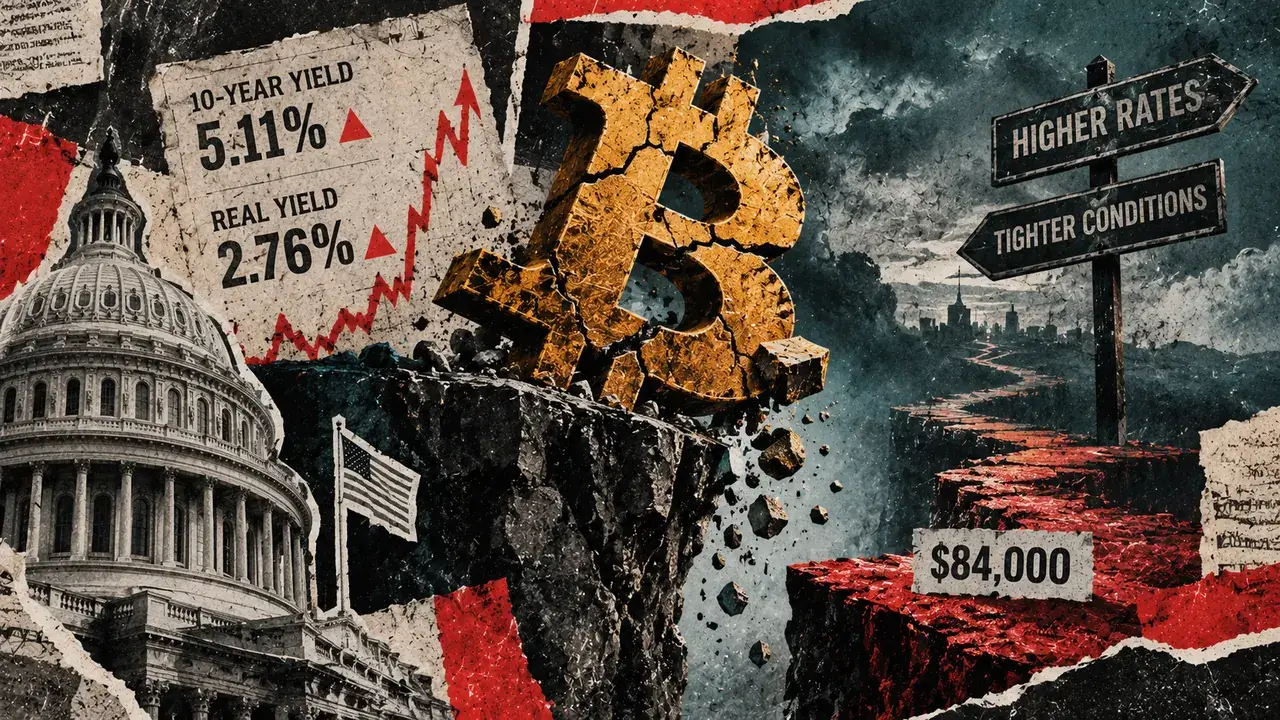
Why surging US real yields are quietly forcing Bitcoin under $84,000
Bitcoin registered an intraday low at $83,500 on Sept. 23, the same day the US 10-year Treasury yield closed at 5.11%, up 15 basis...

Mid-Sized Bitcoin Wallets Add 113,950 Bitcoin as Price Rally Nears Test
Wallets holding between 100 and 1,000 BTC have added 113,950 Bitcoin since July 15, lifting their combined holdings 2.22% to 5.24...