Litecoin Price Prediction: Why LTC Could Hit $100 and Outperform Bitcoin
Litecoin price started a steady increase above the $65 resistance against the US Dollar. LTC is currently rising and might rally further towards the $100 level. Litecoin started a strong increase above the $55 and $65 le...
Archive context
Older archive item. Useful for background and entity history, but not a fresh market-moving signal.

Litecoin price started a steady increase above the $65 resistance against the US Dollar. LTC is currently rising and might rally further towards the $100 level.
- Litecoin started a strong increase above the $55 and $65 levels against the US Dollar.
- The price is now trading above $65 and the 100 simple moving average (4-hours).
- There is a key bearish trend line forming with resistance near $77.50 on the 4-hours chart of the LTC/USD pair (data feed from Kraken).
- The price must clear the $77.50 and $84 to rise towards the $100 resistance zone.
In the past few days, litecoin price saw a decent increase above the $50 level against the US Dollar. LTC price rallied over 20% and outperformed both bitcoin and ethereum.
There was a move above the $65 and $75 resistance levels. The price even surpassed $80 and settled above the 100 simple moving average (4-hours). It traded as high as $83.35 before there was a downside correction. There was a move below the $80 and $75 support levels.
The price declined below the 23.6% Fib retracement level of the upward move from the $59.17 swing low to $83.35 high. However, litecoin price is now trading above $65 and the 100 simple moving average (4-hours).
It stayed above the 50% Fib retracement level of the upward move from the $59.17 swing low to $83.35 high. On the upside, an immediate resistance is near the $77.50 level.
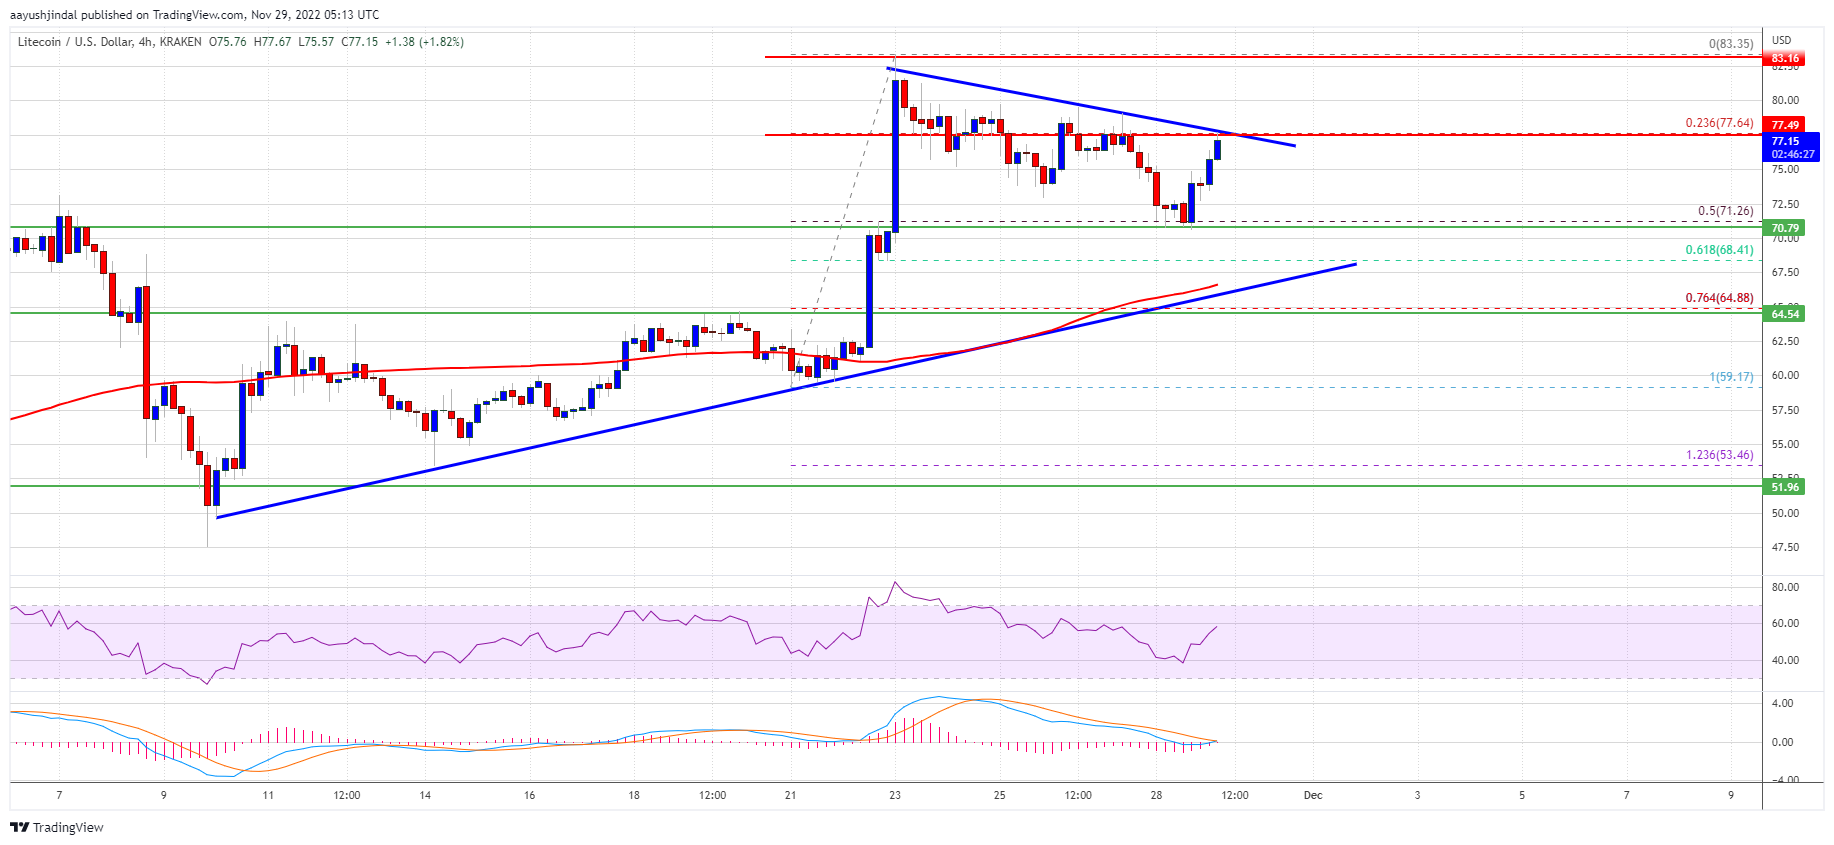
Source: LTCUSD on TradingView.com
There is also a key bearish trend line forming with resistance near $77.50 on the 4-hours chart of the LTC/USD pair. If there is a clear break above the $77.50 resistance, the price could start a strong increase. In the stated case, the price is likely to continue higher towards the $85 and $90 levels. Any more gains might send ltc price towards the $100 resistance zone.
Dips Limited in LTC?If Litecoin price fails to clear the $77.50 resistance level, there could be another pullback. An initial support on the downside is near the $71.20 level.
The first major support is forming near the $68 level. Any further losses may perhaps send the price towards the $55 support in the coming sessions.
Technical indicators:
4-hours MACD – The MACD is slowly moving into the bullish zone.
4-hours RSI (Relative Strength Index) – The RSI for LTC/USD is currently above the 50 level.
Major Support Levels – $71.20 followed by $68.00.
Major Resistance Levels – $77.50 and $85.00.
Why this matters
This bitcoin story adds another data point to the current market tape and is useful when read alongside nearby source coverage.
Original source
Read on NewsBTCRelated market context

Ethereum (ETH) Price Prediction: Whale Rotates $155M Into ETH as Longs Surge Near $2,500
Ethereum is trying to stabilize after another volatile stretch, with price returning toward the mid-$2,400 region while several po...

Ethereum Glamsterdam Upgrade Delayed Over Smart Contract Security Risks
Ethereum developers have postponed the Glamsterdam upgrade on the Hoodi testnet after researchers identified potential security ri...
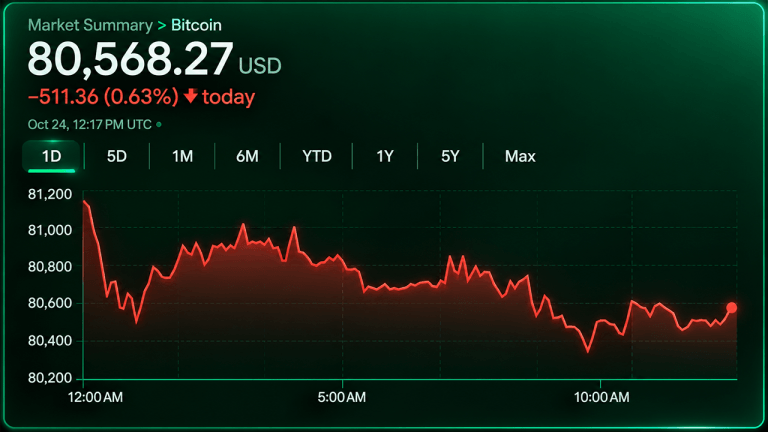
Bitcoin Price Faces $78K Threat as Sellers Hammer Key Support
Bitcoin’s price traded near $80,500 Saturday morning, Oct. 24, with sellers controlling the shorter time frames despite longer-ter...

Bitcoin ETFs Lose Over $635M In One Day Following Oil Price Spike
Bitcoin Magazine Bitcoin ETFs Lose Over $635M In One Day Following Oil Price Spike U.S. investors quickly reversed course on Thurs...

Gold, silver lose $1.3T in 4 days; Bitcoin holds above $80K
The shift towards Bitcoin amidst precious metals' decline highlights changing investor strategies in response to inflation and int...
Bitcoin Hashrate Reclaims One Zettahash As Mining Competition Rebounds
TL;DR: BlocksBridge reported Bitcoin’s seven-day hashrate above one zettahash in the week to October 22. Mining competition has re...