Mapping Bitcoin’s Bull Cycle Potential
Bitcoin Magazine Mapping Bitcoin’s Bull Cycle Potential Bitcoin’s Market Value to Realized Value, or MVRV ratio, remains one of the most reliable on-chain indicators for identifying local and macro tops and bottoms acros...
Archive context
Older archive item. Useful for background and entity history, but not a fresh market-moving signal.

Bitcoin Magazine
Mapping Bitcoin’s Bull Cycle Potential
Bitcoin’s Market Value to Realized Value, or MVRV ratio, remains one of the most reliable on-chain indicators for identifying local and macro tops and bottoms across every BTC cycle. By isolating data across different investor cohorts and adapting historical benchmarks to modern market conditions, we can generate more accurate insights into where Bitcoin may be headed next.
The Bitcoin MVRV RatioThe MVRV Ratio compares Bitcoin’s market price to its realized price, essentially the average cost basis for all coins in the network. As of writing, BTC trades around $105,000 while the realized price floats near $47,000, putting the raw MVRV at 2.26. The Z-Score version of MVRV standardizes this ratio based on historical volatility, enabling clearer comparisons across different market cycles.
Figure 1: Historically, the MVRV Ratio and the MVRV Z-Score have accurately identified cycle peaks and bottoms. View Live Chart Short-Term HoldersShort-term holders, defined as those holding Bitcoin for 155 days or less, currently have a realized price near $97,000. This metric often acts as dynamic support in bull markets and resistance in bear markets. Notably, when the Short Term Holder MVRV hits 1.33, local tops have historically occurred, as seen several times in both the 2017 and 2021 cycles. So far in the current cycle, this threshold has already been touched four times, each followed by modest retracements.
Figure 2: Short Term Holder MVRV reaching 1.33 in more recent cycles has aligned with local tops. View Live Chart Long-Term HoldersLong-term holders, who’ve held BTC for more than 155 days, currently have an average cost basis of just $33,500, putting their MVRV at 3.11. Historically, Long Term Holder MVRV values have reached as high as 12 during major peaks. That said, we’re observing a trend of diminishing multiples each cycle.
Figure 3: Achieving a Long Term Holder MVRV value of 8 could extrapolate to a BTC price in excess of $300,000. View Live ChartA key resistance band now sits between 7.5 and 8.5, a zone that has defined bull tops and pre-bear retracements in every cycle since 2011. If the current growth of the realized price ($40/day) continues for another 140–150 days, matching previous cycle lengths, we could see it reach somewhere in the region of $40,000. A peak MVRV of 8 would imply a price near $320,000.
A Smarter Market CompassUnlike static all-time metrics, the 2-Year Rolling MVRV Z-Score adapts to evolving market dynamics. By recalculating average extremes over a rolling window, it smooths out Bitcoin’s natural volatility decay as it matures. Historically, this version has signaled overbought conditions when reaching levels above 3, and prime accumulation zones when dipping below -1. Currently sitting under 1, this metric suggests that substantial upside remains.
Figure 4: The current 2-Year Rolling MVRV Z-Score suggests more positive price action ahead. View Live Chart Timing & TargetsA view of the BTC Growth Since Cycle Lows chart illustrates that BTC is now approximately 925 days removed from its last major cycle low. Historical comparisons to previous bull markets suggest we may be around 140 to 150 days away from a potential top, with both the 2017 and 2021 peaks occurring around 1,060 to 1,070 days after their respective lows. While not deterministic, this alignment reinforces the broader picture of where we are in the cycle. If realized price trends and MVRV thresholds continue on current trajectories, late Q3 to early Q4 2025 may bring final euphoric moves.
Figure 5: Will the current cycle continue to exhibit growth patterns similar to those of the previous two cycles? View Live Chart ConclusionThe MVRV ratio and its derivatives remain essential tools for analyzing Bitcoin market behavior, providing clear markers for both accumulation and distribution. Whether observing short-term holders hovering near local top thresholds, long-term holders nearing historically significant resistance zones, or adaptive metrics like the 2-Year Rolling MVRV Z-Score signaling plenty of runway left, these data points should be used in confluence.
No single metric should be relied upon to predict tops or bottoms in isolation, but taken together, they offer a powerful lens through which to interpret the macro trend. As the market matures and volatility declines, adaptive metrics will become even more crucial in staying ahead of the curve.
For more deep-dive research, technical indicators, real-time market alerts, and access to a growing community of analysts, visit BitcoinMagazinePro.com.
Disclaimer: This article is for informational purposes only and should not be considered financial advice. Always do your own research before making any investment decisions.
This post Mapping Bitcoin’s Bull Cycle Potential first appeared on Bitcoin Magazine and is written by Matt Crosby.
Why this matters
This bitcoin story adds another data point to the current market tape and is useful when read alongside nearby source coverage.
Original source
Read on Bitcoin MagazineRelated market context

Winklevoss twins gave Trump’s super PAC $10 million 23 days after CFTC joined Gemini relief bid
Newly filed federal election records show Cameron and Tyler Winklevoss gave $10.018 million in Bitcoin to MAGA Inc., the super PAC...
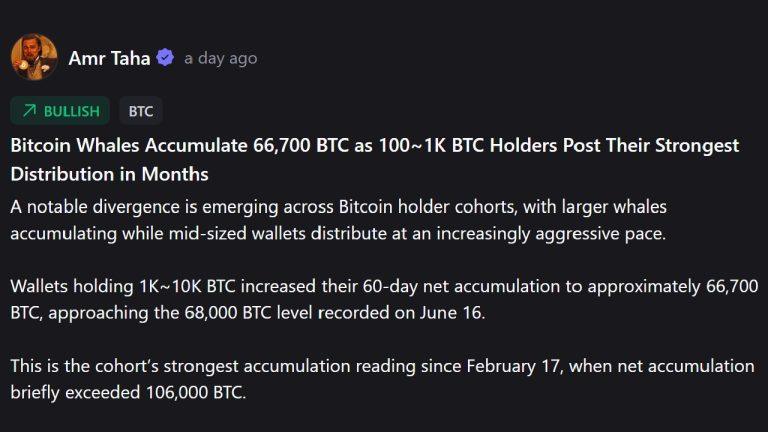
Whales vs. Mid-Tier Holders: The Dramatic Shift in Bitcoin Ownership Splitting the Market
Cryptoquant analyst Amr Taha noticed a divergence between these two bitcoin ownership blocks that might be bullish into the future...

Coinbase supports LCX token migration, will pause deposits and withdrawals July 27-29
Coinbase will pause LCX deposits and withdrawals July 27-29 to support a 1:1 token migration tied to MiCA compliance. Here's what...

Galaxy (GLXY) Commits $5 Million to Prepare Bitcoin for the Quantum Threat
Bitcoin Magazine Galaxy (GLXY) Commits $5 Million to Prepare Bitcoin for the Quantum Threat Galaxy Digital launched a Bitcoin Quan...

Strategy’s Bitcoin metrics go negative amid $3.2B cash – sells 7.5M shares but buys 0 BTC for 4 weeks
Michael Saylor-led Strategy sold another $263.5 million of common stock last week, but the company used the fundraising to expand...

Italian Football Federation reportedly in talks with Pep Guardiola, and here’s why crypto markets should pay attention
Italy's reported talks with Pep Guardiola could ripple into crypto markets through fan tokens and sports blockchain platforms tied...