Peter Brandt Predicts When Bitcoin Price Might Reach $150,000, Technical Signals Show Where Market Is At
Bitcoin’s price action has broken above $96,000 in the past 24 hours, strengthening the case for a sustained move into six-figure territory. This recent price action is particularly significant as it marks a clean breako...
Archive context
Older archive item. Useful for background and entity history, but not a fresh market-moving signal.

Bitcoin’s price action has broken above $96,000 in the past 24 hours, strengthening the case for a sustained move into six-figure territory. This recent price action is particularly significant as it marks a clean breakout above a key on-chain resistance zone stretching from $93,000 to $95,000, which many analysts believe could determine whether Bitcoin’s next leg takes it into six-figure territory.
Supporting this momentum is a long-term technical outlook by renowned trader Peter Brandt, who projected that Bitcoin remains on course to set new all-time highs, with a potential price peak exceeding $150,000 on his projected timeline.
Peter Brandt Maps Timeline For $150,000 Bitcoin Top With Parabolic StructureVeteran trader Peter Brandt shared a weekly candlestick Bitcoin price chart on social media, highlighting a path toward $150,000 by late summer 2025. According to Brandt’s post on social media platform X, Bitcoin is currently trading below a parabolic trendline that is key to the final leg of the current bull cycle. Interestingly, this parabolic trendline has served as an upper resistance for Bitcoin’s price peaks and all-time highs since 2021.
Related Reading: Bitcoin Price Prediction: The Last Leg-Up That Confirms A Resounding Rally To $150,000
Brandt’s chart captures a variety of classical technical formations, including multiple head and shoulders patterns, expanding triangles, and consolidation wedges. The breakout from the recent wedge pattern serves as his basis for suggesting that the bull market is structurally intact.
According to his projection, the parabolic slope that Bitcoin needs to overcome currently sits around the $120,000 mark. A decisive breakout above this threshold would set the stage for a run-up to a cycle top. Brand noted that this cycle top would be between $125,000 and $150,000, and the timeline is by August or September 2025.
On-Chain Indicators Reveal Pressure Points Around $93,000 To $95,000On-chain data from on-chain analytics firm Glassnode shows that Bitcoin is currently testing the convergence of two critical resistance points: the 111-day simple moving average, which now sits at $91,300, and the short-term holder cost basis, which sits at $93,200.
Related Reading: Bitcoin Price: Analyst Peter Brandt Says BTC Still Bearish Unless This Happens
Notably, Bitcoin’s price structure has confirmed a higher high relative to a high of $94,000 in early May, effectively breaking the downtrend from early April. This suggests that the market may be shifting into a more aggressive accumulation phase. However, this region also represents a significant cluster of previously bought coins, meaning investors underwater during earlier pullbacks now find themselves near break-even. This could cause increased sell-side pressure if some traders take profit or exit at breakeven.
Meanwhile, long-term holders continue to exhibit strong HOLDling behavior, with realized profits exceeding 350% for many. In fact, over 254,000 BTC have crossed the 155-day threshold since Bitcoin’s recent local bottom, indicating that a significant portion of the supply is maturing into long-term holdings. Many of these coins were acquired at prices above $95,000.
Although current momentum clearly favours the bulls, the $93,000 to $95,000 range is a major battleground that could define Bitcoin’s trajectory in the months ahead of reaching Peter Brandt’s target of $150,000.
At the time of writing, Bitcoin is trading at $96,635.
Why this matters
This bitcoin story adds another data point to the current market tape and is useful when read alongside nearby source coverage.
Original source
Read on NewsBTCRelated market context

Elon Musk Grok AI Predicts a Bold Move for Ethereum in 2026
When prompted, the Elon Musk-backed Grok AI predicts a bold move for Ethereum (ETH) over the remainder of 2026. It claims that if...

Bitcoin (BTC) Price Today: BTC Holds Uptrend as $84K FVG Shapes Intraday Setup
The setup comes as on-chain data shows that profit-taking remains relatively contained despite the latest Bitcoin price recovery....

Ethereum (ETH) Price Prediction: Bulls and Bears Face Off as $3,000 Rally Meets Liquidation Risk
Ethereum price is entering a volatile phase after its latest recovery, with buyers trying to defend the recent breakout while sell...

Ripple CEO Brad Garlinghouse Says XRP and Solana Can Both Thrive in Crypto’s Next 5 Years
Garlinghouse’s comments have resurfaced as XRP and Solana both trade near important technical levels following recent gains. “I’m...
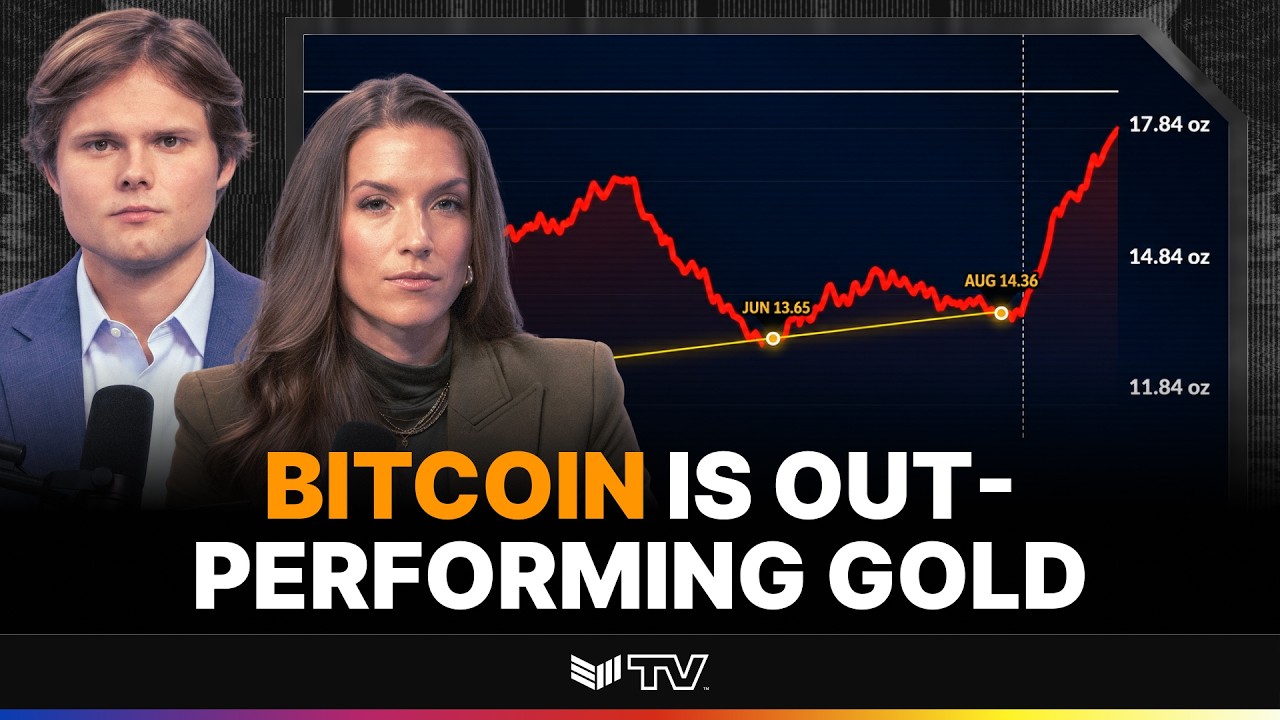
TECHNICAL ANALYSIS: BTC to Cross Key Price Level Against Gold
Bitcoin Magazine TECHNICAL ANALYSIS: BTC to Cross Key Price Level Against Gold The 90-day correlation between Bitcoin and gold jus...

Who Bought Bitcoin’s Breakout? The Answer Will Decide Whether The Price Holds
In August, bitcoin’s rally was driven by spot bitcoin ETFs, which bought for nine straight trading days, and by short sellers who...