TA: Bitcoin Bears Keep Pushing, Why BTC Is At Make-or-Break Levels
Bitcoin is still consolidating near the $20,000 zone against the US Dollar. BTC must clear the $20,550 resistance zone to start a steady increase. Bitcoin is still struggling to gain pace above the $20,550 resistance. Th...
Archive context
Older archive item. Useful for background and entity history, but not a fresh market-moving signal.

Bitcoin is still consolidating near the $20,000 zone against the US Dollar. BTC must clear the $20,550 resistance zone to start a steady increase.
- Bitcoin is still struggling to gain pace above the $20,550 resistance.
- The price is now trading near the $20,000 level and the 100 hourly simple moving average.
- There is a key bearish trend line forming with resistance near $20,330 on the hourly chart of the BTC/USD pair (data feed from Kraken).
- The pair must clear the $20,350 zone and $20,550 to start a fresh increase.
Bitcoin price remained well supported above the $19,550 zone. BTC formed a base and started a fresh upward move above the $20,000 resistance zone.
There was a push above the $20,200 level and the 100 hourly simple moving average. The price even cleared the 61.8% Fib retracement level of the downward move from the $20,576 swing high to $19,555 low. However, the price stayed below the $20,550 resistance zone.
Bitcoin price is now trading near the $20,000 level and the 100 hourly simple moving average. On the upside, an immediate resistance is near the $20,350 level.
There is also a key bearish trend line forming with resistance near $20,330 on the hourly chart of the BTC/USD pair. The trend line is near the 76.4% Fib retracement level of the downward move from the $20,576 swing high to $19,555 low.
Source: BTCUSD on TradingView.com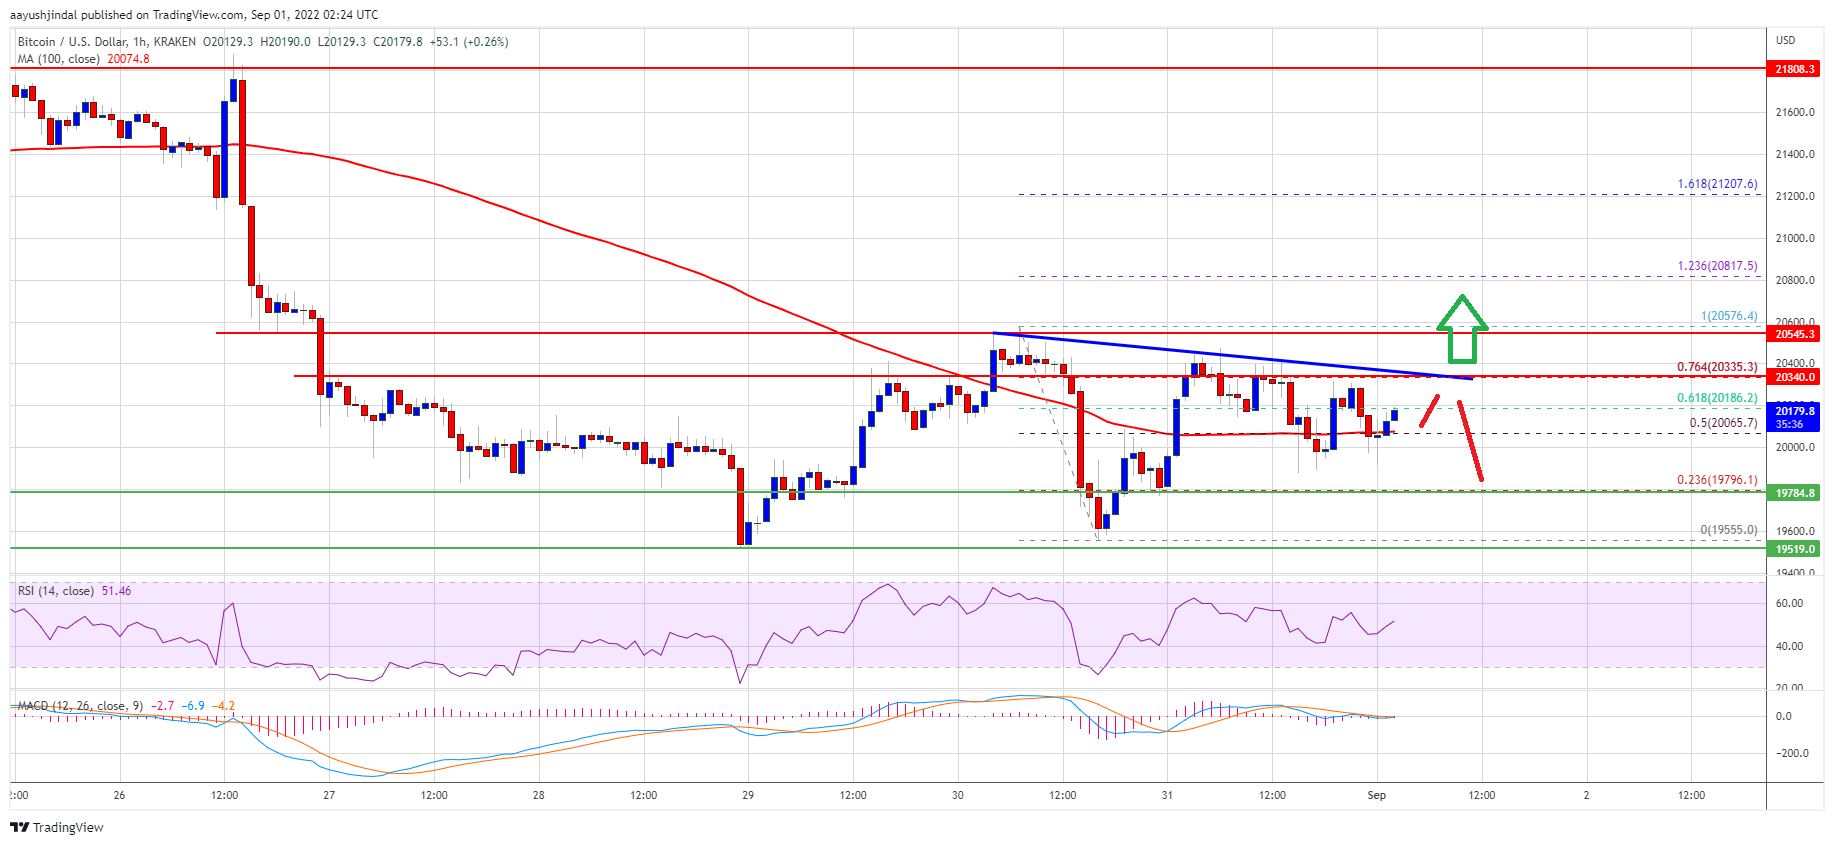
The next major resistance sits near the $20,550 and $20,575 levels. A clear move above the $20,575 resistance might send the price towards $21,000. Any more gains might start a steady move towards the $22,000 resistance zone.
Fresh Decline in BTC?If bitcoin fails to clear the $20,550 resistance zone, it could start another decline. An immediate support on the downside is near the $20,000 zone.
The next major support sits near the $19,800 level. The main support sits near the $19,550 level. A break below the $19,550 support might spark a sharp move to $19,000. Any more losses might call for a move to $18,500 in the near term.
Technical indicators:
Hourly MACD – The MACD is now losing pace in the bullish zone.
Hourly RSI (Relative Strength Index) – The RSI for BTC/USD is now below the 50 level.
Major Support Levels – $19,880, followed by $19,500.
Major Resistance Levels – $20,350, $20,550 and $21,000.
Why this matters
This bitcoin story adds another data point to the current market tape and is useful when read alongside nearby source coverage.
Original source
Read on NewsBTCRelated market context

Solana Holds Near $77 As Traders Look For Real Demand Behind The Bounce
Crypto does not move on one kind of catalyst. Some days it is price, some days it is policy, and some days it is infrastructure. S...

Ethereum Price Approaches $2,000 as Foundation Team Spins Out EthSystems
Ethereum price is heating up as it pounces higher above $1,850, gaining more than 5% over the past day. The $2,000 level is finall...

Bitcoin Price Prediction: ETF Bouncing, Bitwise Sees Bottom and Huge Adoption
Bitcoin is trading near $64,700, up about 4% over the past day after rebounding from an ETF-driven selloff. The latest Bitcoin pri...

Ripple Joins x402 Foundation to Advance RLUSD AI Payments: Will XRP Price Benefit?
XRP price prediction is back in focus as it trades around $1.11, up about 3.6% over the past 24 hours. It remains pinned beneath a...

Crypto News, July 15: Bitcoin and Ethereum Price Jump on Softer CPI and Japan Bitcoin ETF
Bitcoin and Ethereum price climbed after cooler-than-expected U.S. inflation data improved market sentiment. Just hours after, a J...

Bitcoin (BTC) Price Prediction: $65.6K Liquidity Sweep Could Decide Whether BTC Retests $60K or Breaks Higher
While short-term technical indicators suggest buyers are attempting to regain momentum, traders remain cautious as mixed signals a...