TA- Bitcoin (BTC) Trades Above $20,800, Can Bulls Hold This Key Zone?
Bitcoin (BTC) trades below $23,000 against Tether (USDT) after weeks of showing strong bullish signs as investors shift sentiments from bull to bear trap. The price of BTC failed to sustain its bullish structure as it br...
Archive context
Older archive item. Useful for background and entity history, but not a fresh market-moving signal.

Bitcoin (BTC) trades below $23,000 against Tether (USDT) after weeks of showing strong bullish signs as investors shift sentiments from bull to bear trap.
The price of BTC failed to sustain its bullish structure as it breaks below zones leaving investors confused as Bitcoin trades just above the weekly key zone.
Bitcoin (BTC) Trade Analysis On The Weekly Chart Weekly BTC Price Chart Analysis | Source: BTCUSDT On Tradingview.comFrom the chart, the price of BTC saw a weekly low of $22,800, which bounced from that area and rallied to a price of $25,200 after showing great recovery signs in recent weeks.
BTC’s weekly candle closed with a bullish sentiment with the new week’s candle looking bearish showing signs of weakness.
The price has struggled to build more momentum as it tries to hold key support.
If the price of BTC on the weekly chart continues with this structure, it could quickly revisit $20,800 acting as key support. The price of BTC needs to hold this support zone to avoid going lower to the region of $19,000.
Weekly resistance for the price of BTC – $22,500.
Weekly support for the price of BTC – $20,800.
Price Of BTC On The Daily (1D) Chart Daily BTC Price Chart Analysis | Source: BTCUSDT On Tradingview.comThe price of BTC broke to the downside of a rising wedge with more sell orders leading to BTC breaking key support zones.
BTC’s price needs to bounce and form support above to avoid panic selling below $20,800.
Bitcoin has shown strength in holding this support, if bulls steps in we could trend higher to a region of $22,500 acting as the resistance for the price of BTC.
At the point of writing, the price of BTC is at $21,300, just below the 50 and 200 Exponential Moving Average (EMA) which corresponds to prices at $23,000 and $28,000.
The Relative Strength Index (RSI) for the price of BTC on the daily chart is below 35, indicating sell orders.
Daily (1D) resistance for BTC price – $22,500.
Daily (1D) support for BTC price – $20,800.
Price Analysis Of BTC On The Four-Hourly (4H) Chart Four-Hourly BTC Price Chart Analysis | Source: BTCUSDT On Tradingview.comThe price of BTC has continued to show a bearish structure below the 50 and 200 EMA price corresponding to $23,000 acting as resistance for the BTC price.
If BTC fails to hold the support region of $20,800, we could see the price retesting the region of $19,000 as the next support area to hold the BTC price. After the retracement by BTC price, we would see a relief bounce before BTC’s next movement.
Four-Hourly (4H) resistance for BTC price – $23,000.
Four-Hourly (4H) support for BTC price – $20,800.
Featured image from zipmex, Charts from TradingView.comWhy this matters
This bitcoin story adds another data point to the current market tape and is useful when read alongside nearby source coverage.
Original source
Read on NewsBTCRelated market context

Bitcoin (BTC) Price Prediction: $74K Liquidity Gap Puts $80K Support to the Test
Meanwhile, data from Glassnode and Fasanara Digital show that traditional financial assets are capturing a growing share of deriva...

Ethereum (ETH) Price Prediction: Whale Rotates $155M Into ETH as Longs Surge Near $2,500
Ethereum is trying to stabilize after another volatile stretch, with price returning toward the mid-$2,400 region while several po...
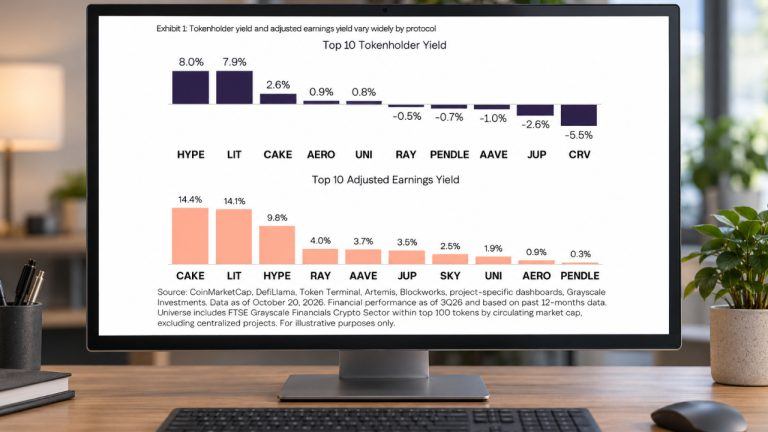
Grayscale Warns Crypto Token Inflation Can Wipe Out Holder Rewards
Crypto applications can generate earnings, yet growing token supplies can reduce the benefits reaching holders. Grayscale’s new an...
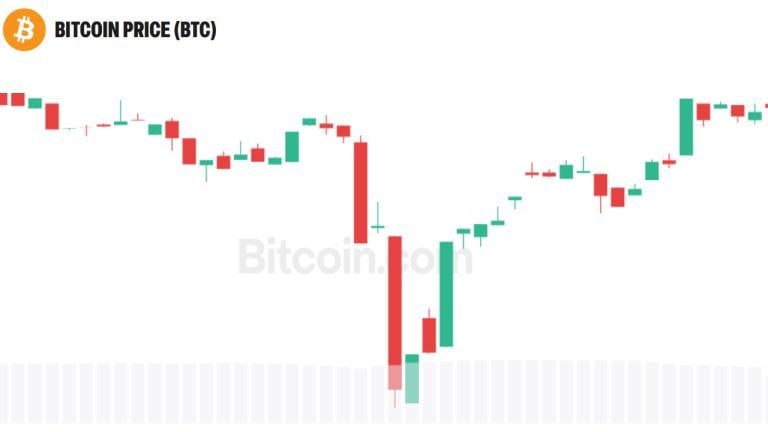
Peter Schiff Warns Bitcoin Could Hit $75K After BTC Fell Below $80K
Peter Schiff sees $75K as bitcoin’s next likely stop after its drop below $80K. The warning follows his concerns about weakening t...
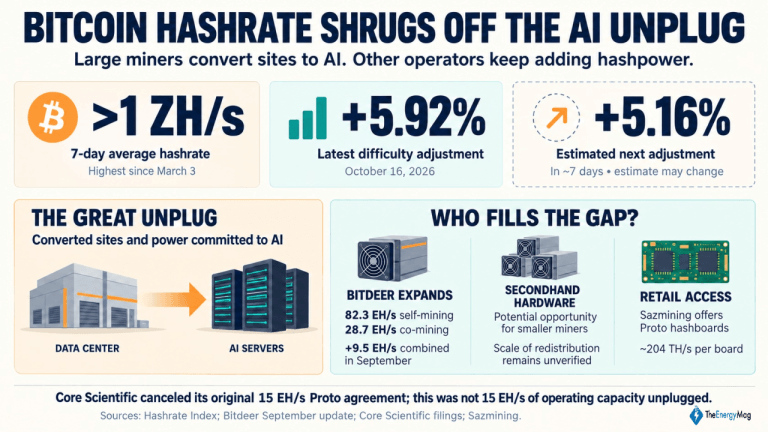
Miner Weekly: Bitcoin Hashrate Shrugs off the AI Unplug, Regaining 1 ZH/s Level
Big public miners are making room for artificial intelligence (AI). Bitcoin’s hashrate is climbing anyway. This article first appe...

Bitwise Dogecoin ETF Reaches Scheduled Liquidation As Holders Face Cash Redemption
TL;DR: Bitwise’s BWOW Dogecoin ETF reached its announced October 22 liquidation distribution date, with remaining shareholders due...