TA: Bitcoin Price At Major Risk of A Breakdown Below $20K: Here’s Why
Bitcoin settled below the $21,000 support zone against the US Dollar. BTC is showing bearish signs and remains at a risk of a major breakdown below $20,000. Bitcoin struggled to correct higher and stayed below the $21,00...
Archive context
Older archive item. Useful for background and entity history, but not a fresh market-moving signal.

Bitcoin settled below the $21,000 support zone against the US Dollar. BTC is showing bearish signs and remains at a risk of a major breakdown below $20,000.
- Bitcoin struggled to correct higher and stayed below the $21,000 resistance zone.
- The price is now trading below $20,750 and the 100 hourly simple moving average.
- There is a key bearish trend line forming with resistance near $20,250 on the hourly chart of the BTC/USD pair (data feed from Kraken).
- The pair is consolidating above the $20,000 level and might start another decline.
Bitcoin price remained in a bearish zone below the $21,000 level. There was a short-term recovery wave, but the bears were active near the $20,300 and $20,350 levels.
The price started a fresh decline and traded below the $20,000 level. It even broke the recent swing low and traded to a new weekly low at $19,619. The price is now trading below $20,750 and the 100 hourly simple moving average.
There is also a key bearish trend line forming with resistance near $20,250 on the hourly chart of the BTC/USD pair. On the upside, an immediate resistance is near the $20,300 level. It is near the 23.6% Fib retracement level of the key drop from the $22,790 swing high to $19,619 low.
A clear move above the trend line and $20,300 might send the price towards the $20,750 resistance. The next major resistance sits near the $21,200 level. It coincides with the 50% Fib retracement level of the key drop from the $22,790 swing high to $19,619 low.
Source: BTCUSD on TradingView.com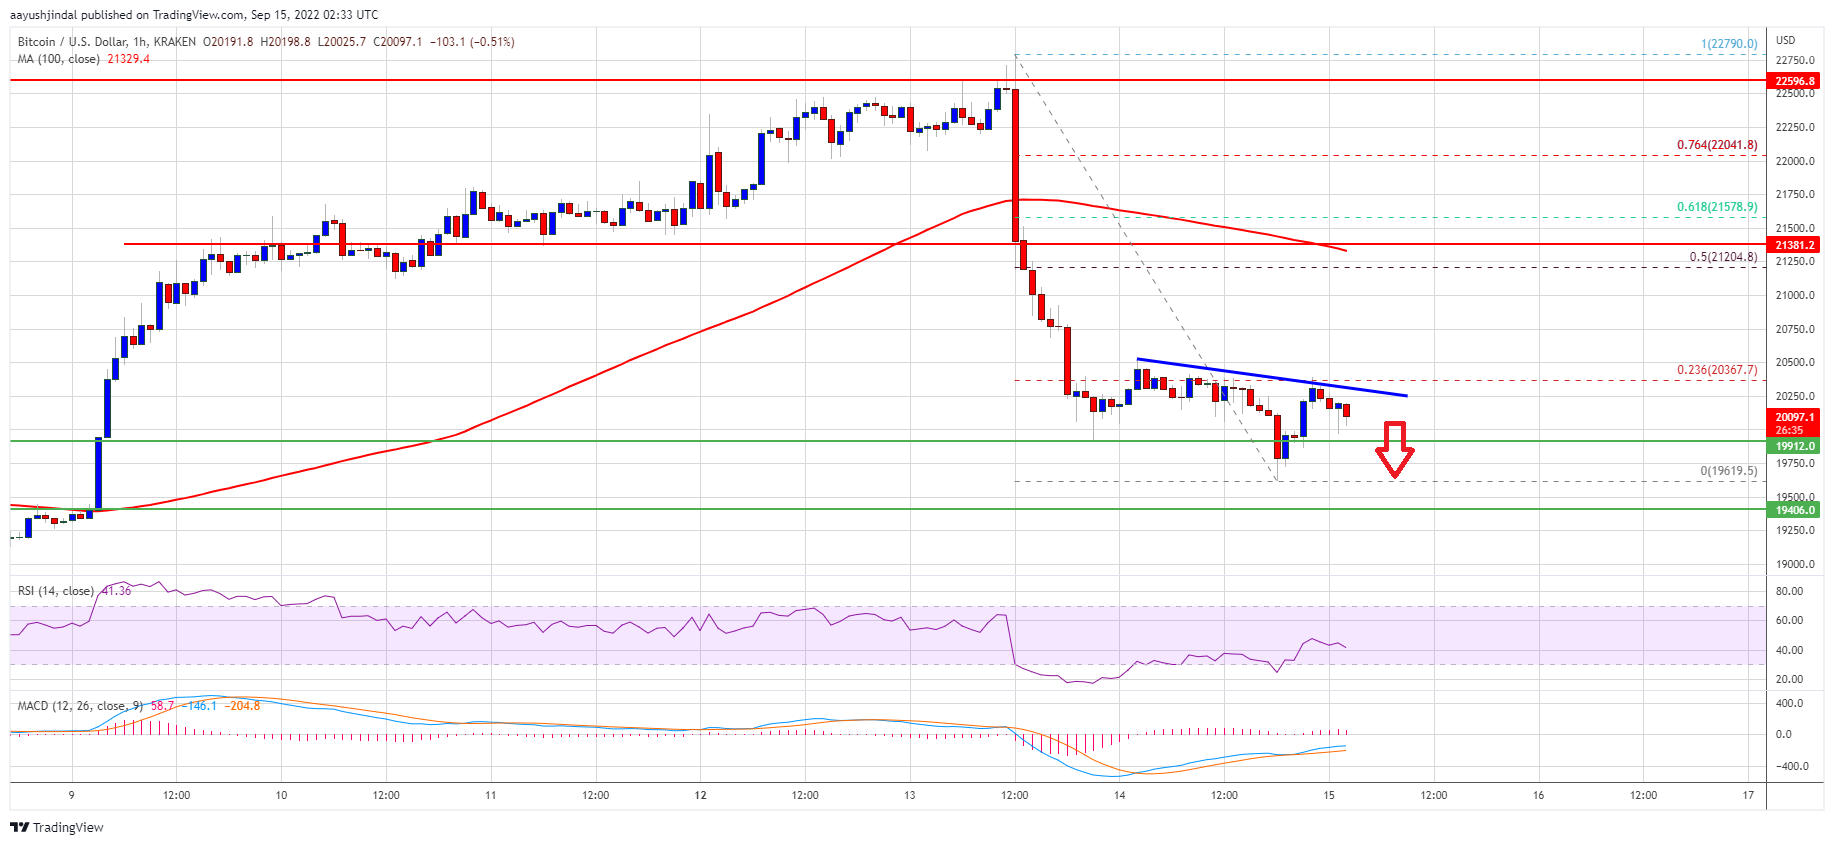
A close above the $21,200 resistance might start a fresh increase. In the stated case, the price may perhaps rise towards $22,000. Any more gains might send the price towards the $22,450 resistance zone.
More Losses in BTC?If bitcoin fails to clear the $20,300 resistance zone, it could continue to move down. An immediate support on the downside is near the $20,000 zone.
The next major support is near the $19,600 and $19,500 levels. A downside break below the $19,500 level might send the price towards the $18,500 support.
Technical indicators:
Hourly MACD – The MACD is now gaining pace in the bearish zone.
Hourly RSI (Relative Strength Index) – The RSI for BTC/USD is now below the 50 level.
Major Support Levels – $20,000, followed by $19,500.
Major Resistance Levels – $20,300, $20,750 and $21,200.
Why this matters
This bitcoin story adds another data point to the current market tape and is useful when read alongside nearby source coverage.
Original source
Read on NewsBTCRelated market context

Near $65K, Bitcoin’s 2 year social media drop off is hiding a $4.3 billion whale exit and a new class of buyers
Crypto discussion across X, Reddit, Telegram, and other major social channels has fallen to its second-lowest daily level since Oc...

Bitcoin Price Prediction: ETF Bouncing, Bitwise Sees Bottom and Huge Adoption
Bitcoin is trading near $64,700, up about 4% over the past day after rebounding from an ETF-driven selloff. The latest Bitcoin pri...

Ripple Joins x402 Foundation to Advance RLUSD AI Payments: Will XRP Price Benefit?
XRP price prediction is back in focus as it trades around $1.11, up about 3.6% over the past 24 hours. It remains pinned beneath a...

Ethereum Price Approaches $2,000 as Foundation Team Spins Out EthSystems
Ethereum price is heating up as it pounces higher above $1,850, gaining more than 5% over the past day. The $2,000 level is finall...

FIFA World Cup 2026 fan zones highlight how major sports events are skipping crypto sponsorships
The absence of crypto sponsorships at major sports events like the FIFA World Cup 2026 indicates a shift in market dynamics and tr...
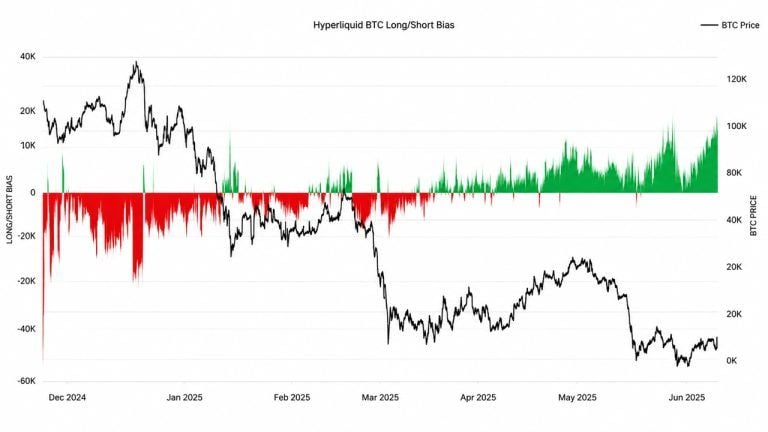
Glassnode: Hyperliquid Bitcoin Longs Just Topped Levels From Q2’s $83K Run
Top traders on Hyperliquid are running some of the most aggressive bitcoin long positioning ever recorded by Glassnode, exceeding...