TA: Bitcoin Price Attempts Recovery, Why 100 SMA Is The Key
Bitcoin started an upside correction from the $18,223 low against the US Dollar. BTC climbed above $19,000, but it is now facing resistance near the 100 hourly SMA. Bitcoin traded as low as $18,223 before it started an u...
Archive context
Older archive item. Useful for background and entity history, but not a fresh market-moving signal.

Bitcoin started an upside correction from the $18,223 low against the US Dollar. BTC climbed above $19,000, but it is now facing resistance near the 100 hourly SMA.
- Bitcoin traded as low as $18,223 before it started an upside correction.
- The price is still trading below $20,000 and the 100 hourly simple moving average.
- There is a key bearish trend line forming with resistance near $19,650 on the hourly chart of the BTC/USD pair (data feed from Kraken).
- The pair must clear the trend line and the 100 hourly SMA to continue higher towards $20,500.
Bitcoin price extended losses after it settled below the $19,000 level. BTC broke the $18,500 support zone and traded as low as $18,223.
There was no test of the $18,000 zone and the price started an upside correction. There was a steady increase above the $18,500 and $18,800 levels. The price was able to clear the 50% Fib retracement level of the downward move from the $20,198 swing high to $18,223 low.
Bitcoin price even spiked above the $19,500 resistance zone. However, the bears were active near the $19,600 level and the 100 hourly simple moving average.
There is also a key bearish trend line forming with resistance near $19,650 on the hourly chart of the BTC/USD pair. The trend line is near the 76.4% Fib retracement level of the downward move from the $20,198 swing high to $18,223 low.
Source: BTCUSD on TradingView.com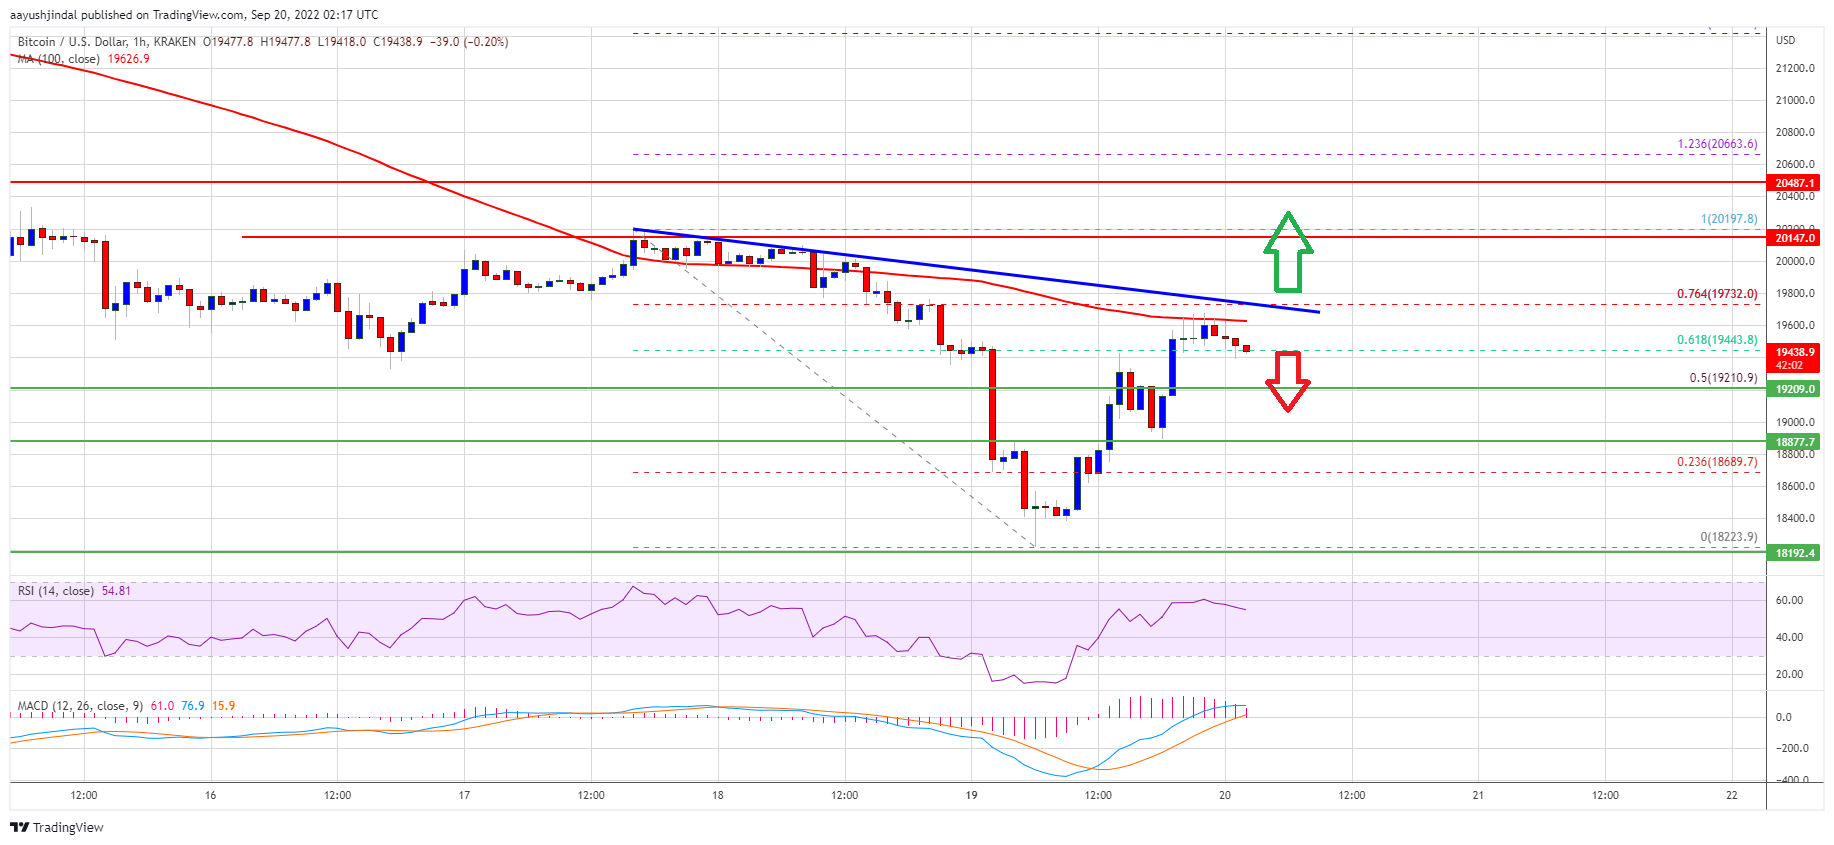
On the upside, an immediate resistance is near the $19,600 level and the trend line. The next major resistance sits near the $20,000 level. Any more gains might send the price towards the $20,500 resistance zone. Furthermore, if the bulls remain in action, the price could test $21,200.
Fresh Decline in BTC?If bitcoin fails to continue higher above the $19,600 resistance zone, it could start a fresh decline. An immediate support on the downside is near the $19,200 zone.
The next major support is near the $18,850 level. A clear move below the $18,850 and $18,800 levels might open the doors for a move towards the $18,223 low or even to a new low.
Technical indicators:
Hourly MACD – The MACD is now losing pace in the bullish zone.
Hourly RSI (Relative Strength Index) – The RSI for BTC/USD is now above the 50 level.
Major Support Levels – $19,200, followed by $18,850.
Major Resistance Levels – $19,600, $19,650 and $20,500.
Why this matters
This bitcoin story adds another data point to the current market tape and is useful when read alongside nearby source coverage.
Original source
Read on NewsBTCRelated market context

Ethereum Price Approaches $2,000 as Foundation Team Spins Out EthSystems
Ethereum price is heating up as it pounces higher above $1,850, gaining more than 5% over the past day. The $2,000 level is finall...

Crypto News, July 15: Bitcoin and Ethereum Price Jump on Softer CPI and Japan Bitcoin ETF
Bitcoin and Ethereum price climbed after cooler-than-expected U.S. inflation data improved market sentiment. Just hours after, a J...

Bitcoin (BTC) Price Prediction: $65.6K Liquidity Sweep Could Decide Whether BTC Retests $60K or Breaks Higher
While short-term technical indicators suggest buyers are attempting to regain momentum, traders remain cautious as mixed signals a...

Bitcoin Price Prediction: ETF Bouncing, Bitwise Sees Bottom and Huge Adoption
Bitcoin is trading near $64,700, up about 4% over the past day after rebounding from an ETF-driven selloff. The latest Bitcoin pri...

Ethereum Reclaims $1,800 As ETF Hopes Meet A Friendlier Macro Tape
There is a useful difference between a noisy headline and a story that actually changes the market’s understanding of a sector. Et...

A timeline of the Ethereum Foundation's ongoing shakeup
In this week's edition of The Protocol Newsletter, we’re unpacking the timeline of all the changes at the Ethereum Foundation this...