TA: Bitcoin Price Breakdown Looks Real, Why BTC Could Dive To $18K
Bitcoin broke the key $19,500 support against the US Dollar. BTC is showing bearish signs and remains at a risk of a move towards the $18,000 level. Bitcoin failed to start a fresh increase and declined below the $19,500...
Archive context
Older archive item. Useful for background and entity history, but not a fresh market-moving signal.

Bitcoin broke the key $19,500 support against the US Dollar. BTC is showing bearish signs and remains at a risk of a move towards the $18,000 level.
- Bitcoin failed to start a fresh increase and declined below the $19,500 support.
- The price is now trading below the $19,000 level and the 100 hourly simple moving average.
- There is a connecting bearish trend line forming with resistance near $19,420 on the hourly chart of the BTC/USD pair (data feed from Kraken).
- The pair could correct higher, but upsides might be limited above $19,500.
Bitcoin price failed to gain pace for a move above the $20,500 and $20,550 resistance levels. There were many failed attempts, sparking a downside reaction below the key $19,500 support zone.
There was a sharp decline below the $19,500 support and the 100 hourly simple moving average. The price declined below the $19,200 and $19,000 levels. A low is formed near $18,670 and the price is now consolidating losses.
It is now trading below the $19,000 level and the 100 hourly simple moving average. On the upside, an immediate resistance is near the $19,000 level. It is near the 23.6% Fib retracement level of the recent decline from the $20,171 swing high to $18,670 low.
The next major resistance sits near the $19,400 level. There is also a connecting bearish trend line forming with resistance near $19,420 on the hourly chart of the BTC/USD pair.
Source: BTCUSD on TradingView.com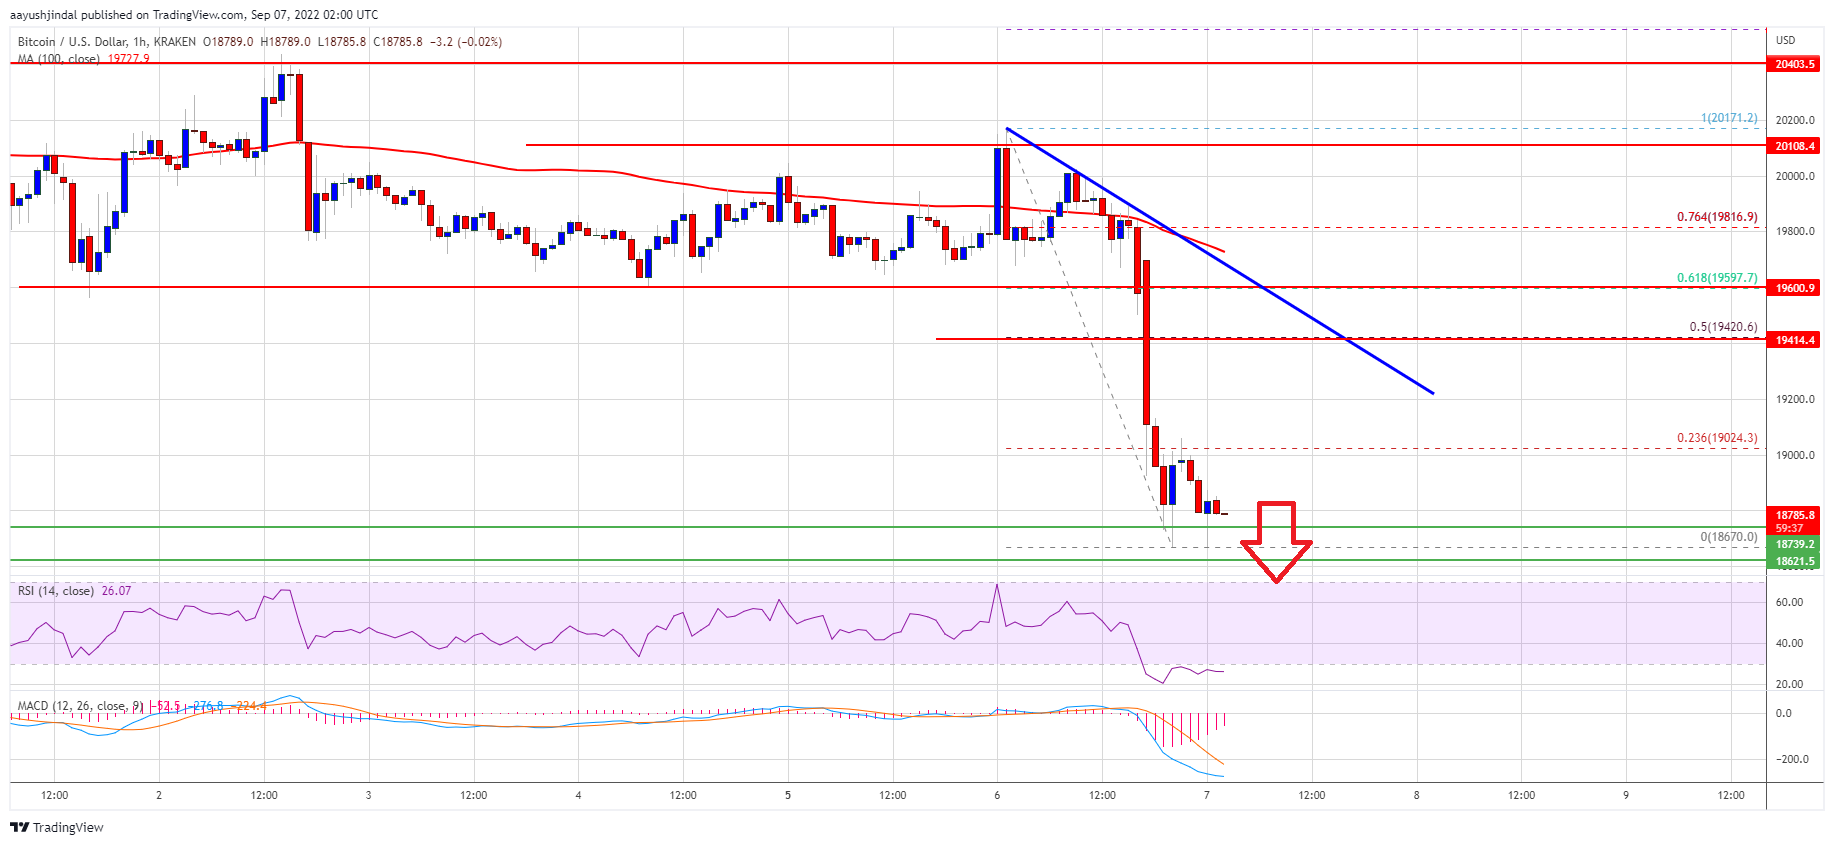
The trend line is near the 50% Fib retracement level of the recent decline from the $20,171 swing high to $18,670 low. Any more gains might send the price towards the $19,800 resistance zone and the 100 hourly simple moving average.
More Losses in BTC?If bitcoin fails to start a recovery wave above the $19,000 zone, it could continue to move down. An immediate support on the downside is near the $18,650 zone.
The next major support sits near the $18,500 level. A downside break below the $18,500 support might spark more downsides. In the stated case, the price may perhaps test the $18,000 support.
Technical indicators:
Hourly MACD – The MACD is now gaining pace in the bearish zone.
Hourly RSI (Relative Strength Index) – The RSI for BTC/USD is now below the 50 level.
Major Support Levels – $18,650, followed by $18,500.
Major Resistance Levels – $19,000, $19,400 and $19,500.
Why this matters
This bitcoin story adds another data point to the current market tape and is useful when read alongside nearby source coverage.
Original source
Read on NewsBTCRelated market context

Ethereum Price Approaches $2,000 as Foundation Team Spins Out EthSystems
Ethereum price is heating up as it pounces higher above $1,850, gaining more than 5% over the past day. The $2,000 level is finall...

Crypto News, July 15: Bitcoin and Ethereum Price Jump on Softer CPI and Japan Bitcoin ETF
Bitcoin and Ethereum price climbed after cooler-than-expected U.S. inflation data improved market sentiment. Just hours after, a J...

Bitcoin (BTC) Price Prediction: $65.6K Liquidity Sweep Could Decide Whether BTC Retests $60K or Breaks Higher
While short-term technical indicators suggest buyers are attempting to regain momentum, traders remain cautious as mixed signals a...

BitMine made $46 million staking Ethereum then lost twice that betting on it
BitMine's push to turn one of the world's largest corporate Ethereum holdings into a source of recurring income generated nearly $...

Solana Holds Near $77 As Traders Look For Real Demand Behind The Bounce
Crypto does not move on one kind of catalyst. Some days it is price, some days it is policy, and some days it is infrastructure. S...

Near $65K, Bitcoin’s 2 year social media drop off is hiding a $4.3 billion whale exit and a new class of buyers
Crypto discussion across X, Reddit, Telegram, and other major social channels has fallen to its second-lowest daily level since Oc...