TA: Bitcoin Price Gearing For Another Lift-Off to $20k, Altcoins Stable
Bitcoin is showing a few positive signs above $19,000 against the US Dollar. BTC could gain bullish momentum if it clears the $19,400 resistance zone. Bitcoin started an upside correction and climbed above $19,000. The p...
Archive context
Older archive item. Useful for background and entity history, but not a fresh market-moving signal.

Bitcoin is showing a few positive signs above $19,000 against the US Dollar. BTC could gain bullish momentum if it clears the $19,400 resistance zone.
- Bitcoin started an upside correction and climbed above $19,000.
- The price is now testing the $19,400 zone and the 100 hourly simple moving average.
- There was a break above a key bearish trend line with resistance near $19,200 on the hourly chart of the BTC/USD pair (data feed from Kraken).
- The pair might start a decent increase if there is a clear move above the $19,500 resistance.
Bitcoin price found support near the $18,550 zone and recently started an upside correction. There was a steady recovery wave above the $19,000 resistance zone.
There was a break above a key bearish trend line with resistance near $19,200 on the hourly chart of the BTC/USD pair. The bulls were able to push the price above the 23.6% Fib retracement level of the downward move from the $20,172 swing high to $18,550 low.
Bitcoin price is now testing the $19,400 zone and the 100 hourly simple moving average. The price is also trading near the 50% Fib retracement level of the downward move from the $20,172 swing high to $18,550 low.
Source: BTCUSD on TradingView.com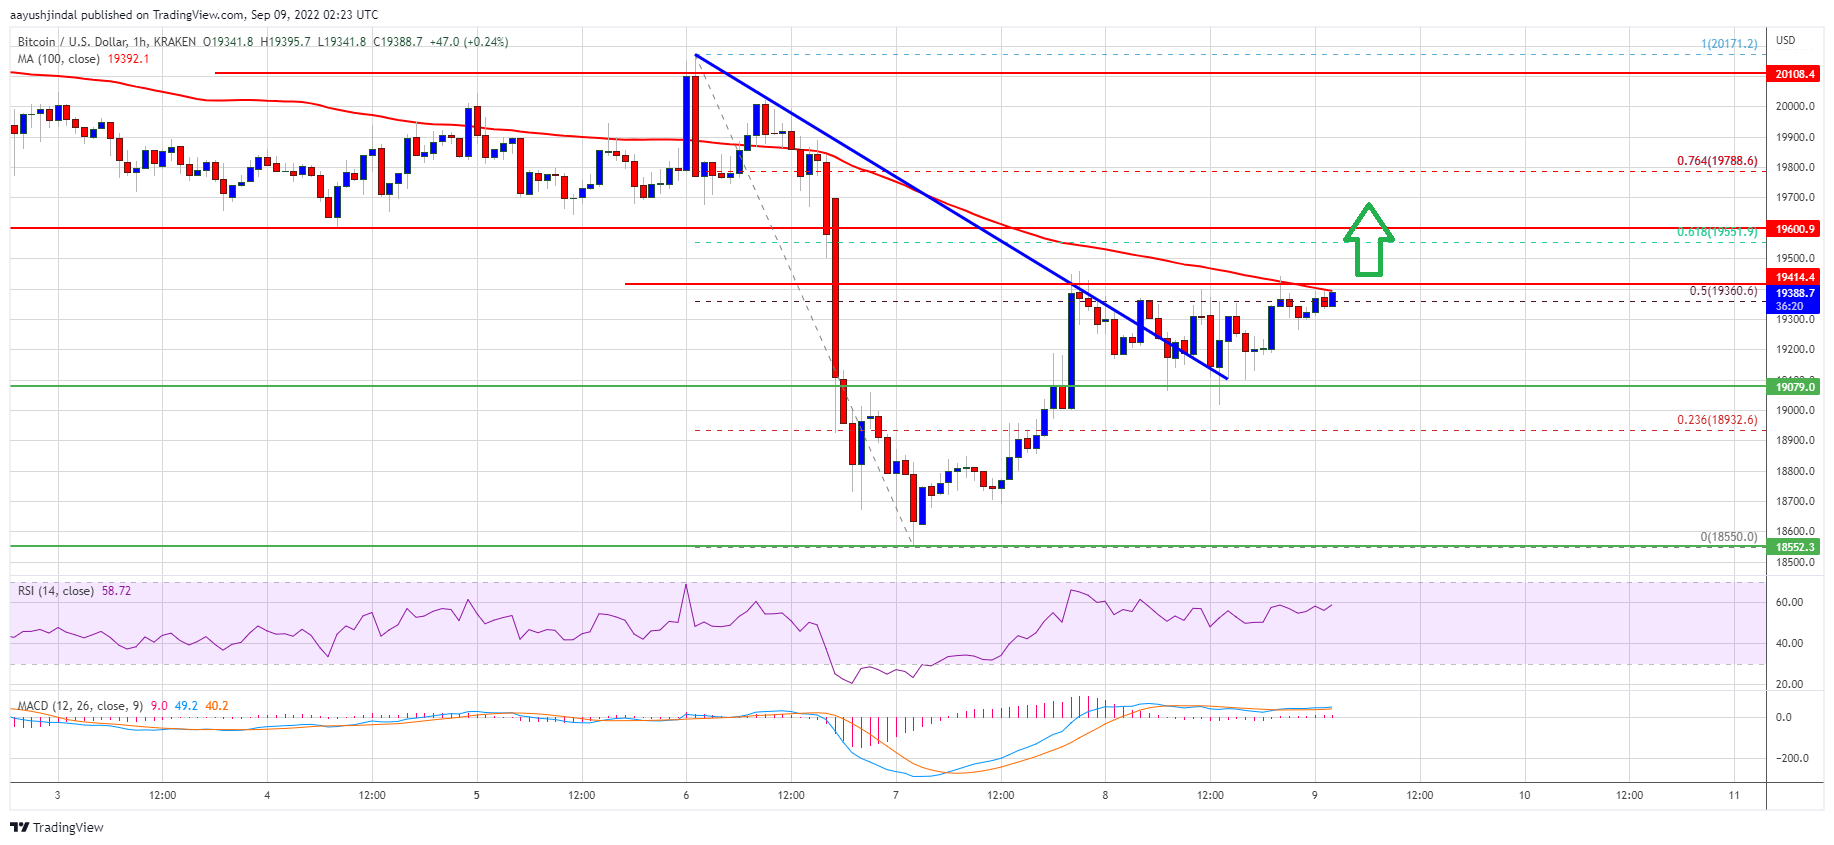
On the upside, an immediate resistance is near the $19,400 level and the 100 hourly simple moving average. The next major resistance sits near the $19,500 level. A proper close above the $19,500 resistance might start a steady increase to $20,000. Any more gains might send the price towards the $20,500 resistance zone.
Fresh Decline in BTC?If bitcoin fails to gain pace above the $19,500 zone, it could start another decline. An immediate support on the downside is near the $19,200 zone.
The first major support is now forming near the $19,070 level. A downside break below the $19,070 level might send the price towards the $18,550 support. Any more losses below $18,550 might put a lot of pressure on the bulls. In the stated case, the price could drop towards the $18,000 support in the near term.
Technical indicators:
Hourly MACD – The MACD is now gaining pace in the bullish zone.
Hourly RSI (Relative Strength Index) – The RSI for BTC/USD is now above the 50 level.
Major Support Levels – $19,070, followed by $18,550.
Major Resistance Levels – $19,400, $19,500 and $20,000.
Why this matters
This bitcoin story adds another data point to the current market tape and is useful when read alongside nearby source coverage.
Original source
Read on NewsBTCRelated market context

Ethereum Price Approaches $2,000 as Foundation Team Spins Out EthSystems
Ethereum price is heating up as it pounces higher above $1,850, gaining more than 5% over the past day. The $2,000 level is finall...

Bitcoin (BTC) Price Prediction: $65.6K Liquidity Sweep Could Decide Whether BTC Retests $60K or Breaks Higher
While short-term technical indicators suggest buyers are attempting to regain momentum, traders remain cautious as mixed signals a...

Crypto News, July 15: Bitcoin and Ethereum Price Jump on Softer CPI and Japan Bitcoin ETF
Bitcoin and Ethereum price climbed after cooler-than-expected U.S. inflation data improved market sentiment. Just hours after, a J...

Bitcoin Price Prediction: ETF Bouncing, Bitwise Sees Bottom and Huge Adoption
Bitcoin is trading near $64,700, up about 4% over the past day after rebounding from an ETF-driven selloff. The latest Bitcoin pri...

Ripple Joins x402 Foundation to Advance RLUSD AI Payments: Will XRP Price Benefit?
XRP price prediction is back in focus as it trades around $1.11, up about 3.6% over the past 24 hours. It remains pinned beneath a...

BitMine made $46 million staking Ethereum then lost twice that betting on it
BitMine's push to turn one of the world's largest corporate Ethereum holdings into a source of recurring income generated nearly $...