TA: Bitcoin Price Holds Ground, Why Close above $20K Is The Key
Bitcoin is holding the key $18,500 support zone against the US Dollar. BTC must settle above the $20,000 resistance zone to move into a positive zone. Bitcoin is struggling to gain momentum above the $19,500 resistance z...
Archive context
Older archive item. Useful for background and entity history, but not a fresh market-moving signal.

Bitcoin is holding the key $18,500 support zone against the US Dollar. BTC must settle above the $20,000 resistance zone to move into a positive zone.
- Bitcoin is struggling to gain momentum above the $19,500 resistance zone.
- The price is trading below $19,000 and the 100 hourly simple moving average.
- There is a key bearish trend line forming with resistance near $19,020 on the hourly chart of the BTC/USD pair (data feed from Kraken).
- The pair could stage a fresh rally if there is a clear move above the $19,500 resistance zone.
Bitcoin price made another attempt to clear the $19,500 resistance zone. However, BTC struggled and formed a short-term top near the $19,400 level.
A high was formed near $19,392 and the price declined. There was a move below the $19,000 level and the 100 hourly simple moving average. The pair traded as low as $18,645 and is currently consolidating losses. There was a minor increase above the $18,800 level.
Bitcoin price climbed above the 23.6% Fib retracement level of the recent decline from the $19,392 swing high to $18,645 low. On the upside, an immediate resistance is near the $19,000 level and the 100 hourly simple moving average.
There is also a key bearish trend line forming with resistance near $19,020 on the hourly chart of the BTC/USD pair. The trend line is near the 50% Fib retracement level of the recent decline from the $19,392 swing high to $18,645 low.
Source: BTCUSD on TradingView.com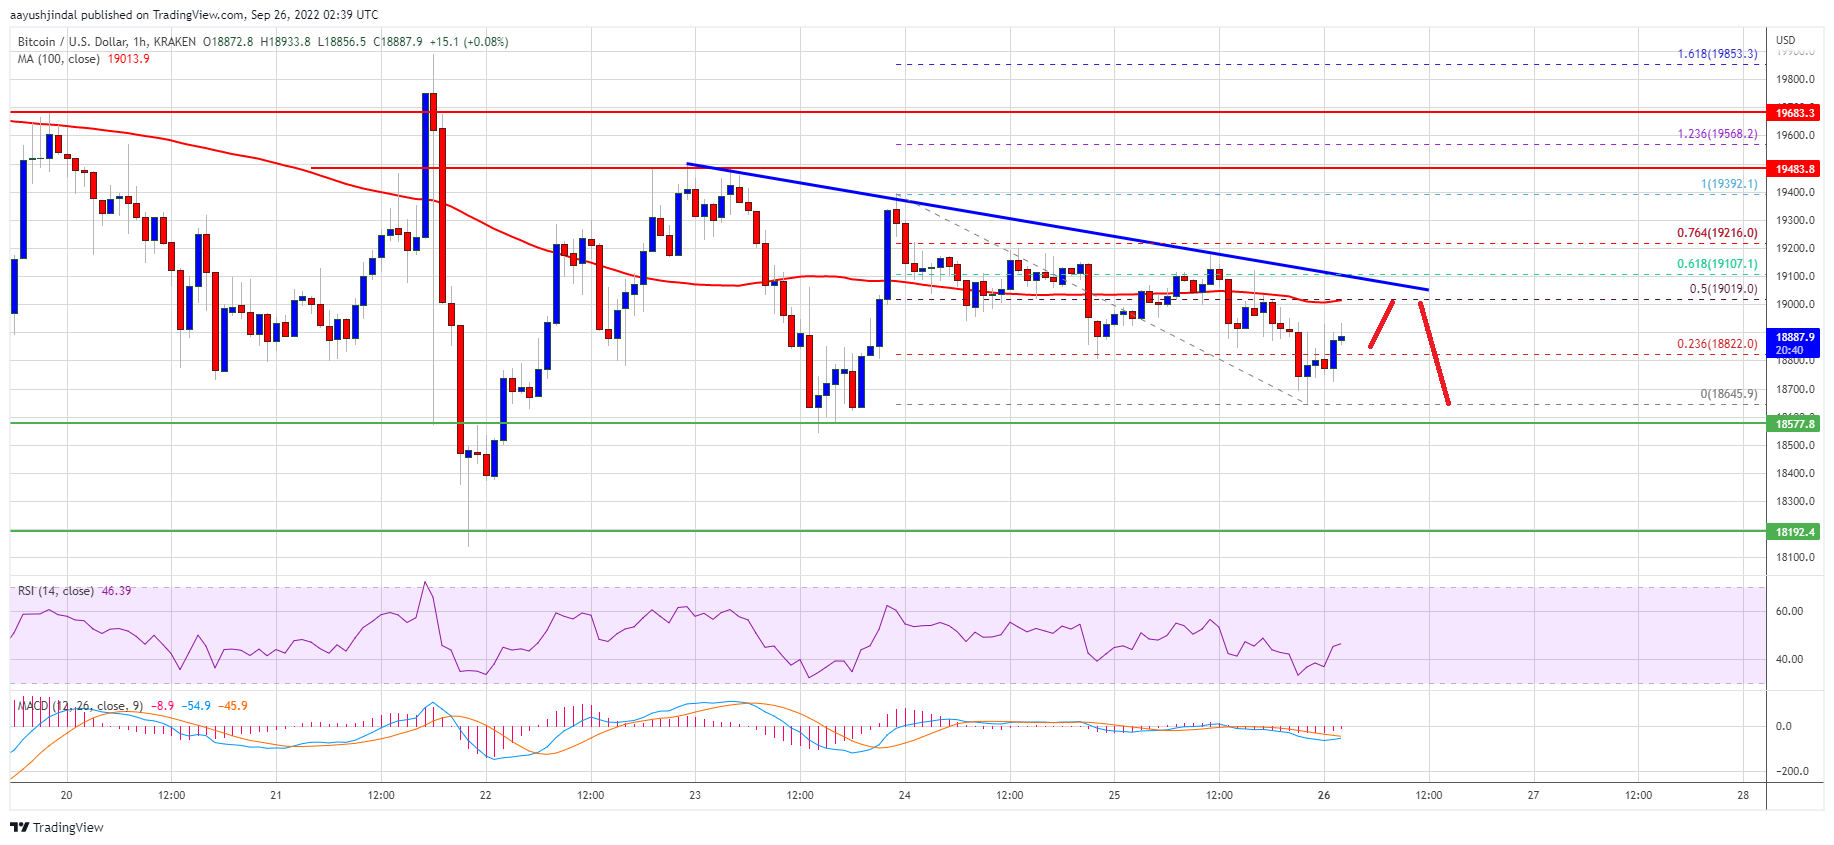
The next major resistance sits near the $19,500 zone. A close above the $19,500 level might start a fresh surge to $20,000. Any more gains might start a steady increase and the price might rise towards the $21,500 resistance zone.
Fresh Decline in BTC?If bitcoin fails to recover above the $19,500 zone, it could start a fresh decline. An immediate support on the downside is near the $18,650 zone.
The next major support is near the $18,500 level. A clear move below the $18,500 zone could set the pace for a fresh decline. In the stated case, the price may even test the $17,500 level.
Technical indicators:
Hourly MACD – The MACD is now losing pace in the bullish zone.
Hourly RSI (Relative Strength Index) – The RSI for BTC/USD is now just below the 50 level.
Major Support Levels – $18,650, followed by $18,500.
Major Resistance Levels – $19,000, $19,350 and $19,500.
Why this matters
This bitcoin story adds another data point to the current market tape and is useful when read alongside nearby source coverage.
Original source
Read on NewsBTCRelated market context

Ethereum Price Approaches $2,000 as Foundation Team Spins Out EthSystems
Ethereum price is heating up as it pounces higher above $1,850, gaining more than 5% over the past day. The $2,000 level is finall...

Ethereum Research Thread Puts Sybil Resistance Back In Focus For Decentralized Networks
Ethereum Research Thread Puts Sybil Resistance Back In Focus For Decentralized Networks is a useful reminder that crypto coverage...

Bitcoin Price Prediction: ETF Bouncing, Bitwise Sees Bottom and Huge Adoption
Bitcoin is trading near $64,700, up about 4% over the past day after rebounding from an ETF-driven selloff. The latest Bitcoin pri...

Crypto News, July 15: Bitcoin and Ethereum Price Jump on Softer CPI and Japan Bitcoin ETF
Bitcoin and Ethereum price climbed after cooler-than-expected U.S. inflation data improved market sentiment. Just hours after, a J...

XRP’s $1 rebound faces holders trapped above $2
Glassnode reported that XRP holders who bought between 6 and 12 months ago have an average cost basis near $2.22, roughly 52% abov...

Bitcoin (BTC) Price Prediction: $65.6K Liquidity Sweep Could Decide Whether BTC Retests $60K or Breaks Higher
While short-term technical indicators suggest buyers are attempting to regain momentum, traders remain cautious as mixed signals a...