TA: Bitcoin Price Makes U-Turn, Why BTC Could Tumble to $18K
Bitcoin started a fresh decline below the $20,000 support zone against the US Dollar. BTC traded below $19,000 and remains at a risk of a move to $18,000. Bitcoin started a fresh decline and traded below the $19,500 supp...
Archive context
Older archive item. Useful for background and entity history, but not a fresh market-moving signal.

Bitcoin started a fresh decline below the $20,000 support zone against the US Dollar. BTC traded below $19,000 and remains at a risk of a move to $18,000.
- Bitcoin started a fresh decline and traded below the $19,500 support.
- The price is now trading below $19,200 and the 100 hourly simple moving average.
- There was a break below a connecting bullish trend line with support at $19,850 on the hourly chart of the BTC/USD pair (data feed from Kraken).
- The pair is now at a risk of a move towards the $18,000 support zone in the near term.
Bitcoin price failed to surpass the $20,500 resistance level. BTC started a fresh decline and traded below the $20,000 and $19,500 support levels.
Besides, there was a break below a connecting bullish trend line with support at $19,850 on the hourly chart of the BTC/USD pair. The pair accelerated lower below the $19,200 level and the 100 hourly simple moving average. It even declined below $19,000 and traded as low as $18,706.
Bitcoin price is now consolidating losses below $19,200 and the 100 hourly simple moving average. On the upside, an immediate resistance is near the $19,050 level. It is near the 23.6% Fib retracement level of the recent decline from the $20,197 swing high to $18,706 low.
The next major resistance sits near the $19,350 level. It coincides with the 50% Fib retracement level of the recent decline from the $20,197 swing high to $18,706 low.
Source: BTCUSD on TradingView.com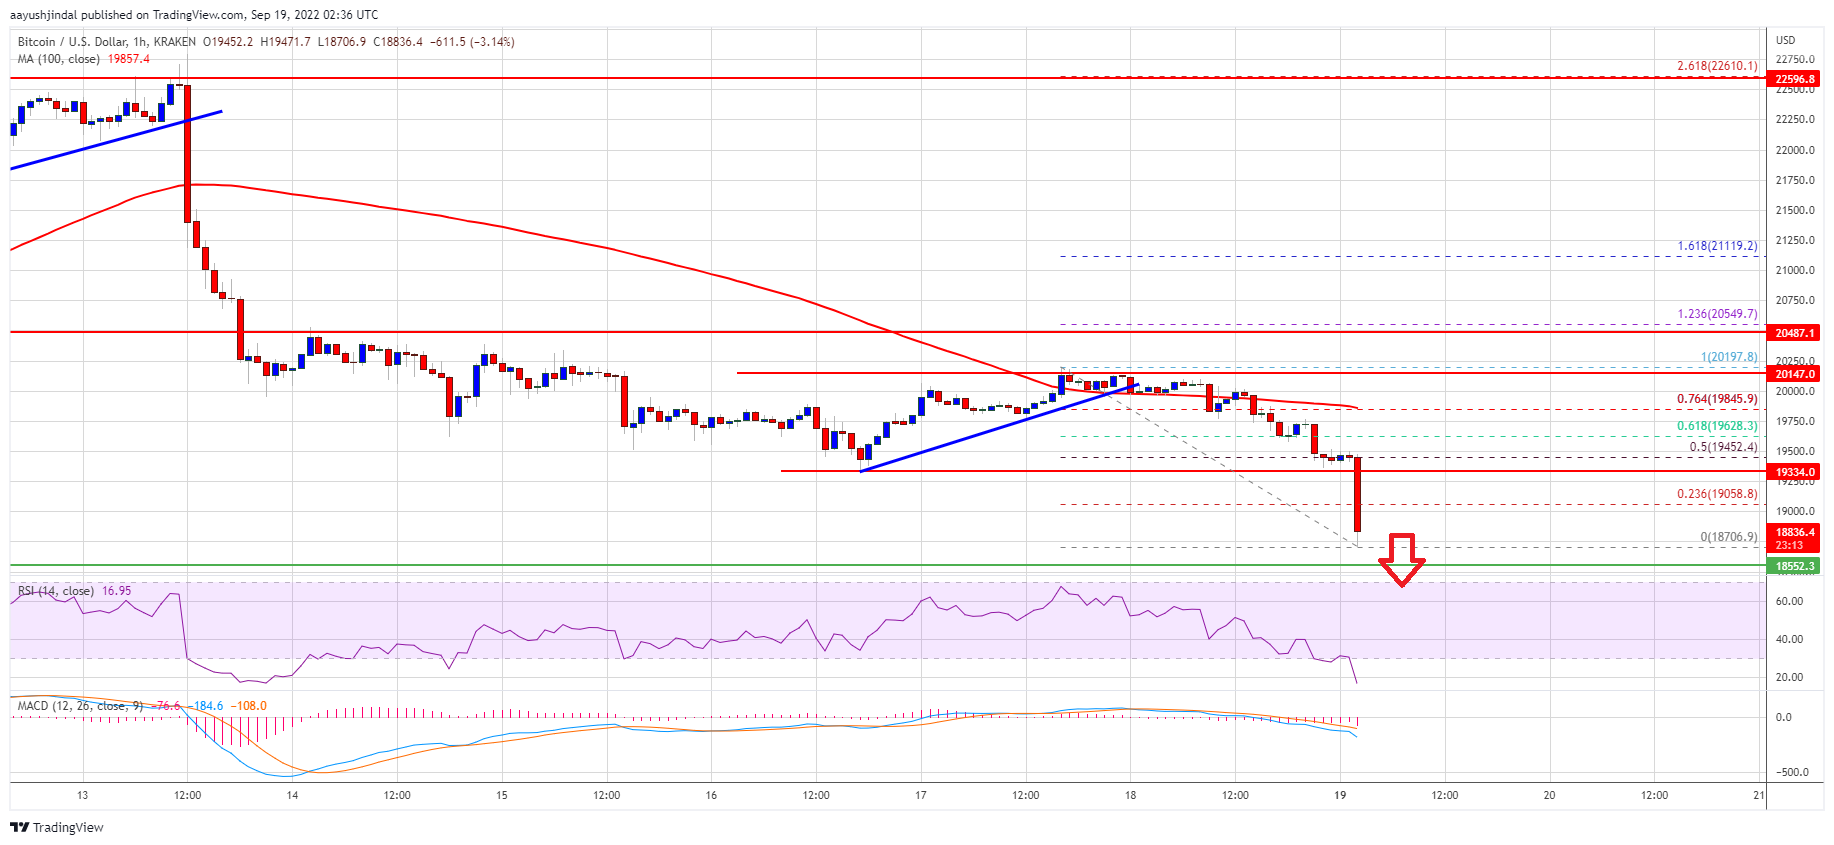
The main barrier is now forming near the $20,000 zone and the 100 hourly simple moving average. A close above the $20,000 resistance might start a fresh increase. In the stated case, the price may perhaps rise towards $21,200.
More Losses in BTC?If bitcoin fails to start a recovery wave above the $19,050 resistance zone, it could continue to move down. An immediate support on the downside is near the $18,700 zone.
The next major support is near the $18,550 level. A clear move below the $18,700 and $18,550 levels might open the doors for a move towards the $18,000 level.
Technical indicators:
Hourly MACD – The MACD is now gaining pace in the bearish zone.
Hourly RSI (Relative Strength Index) – The RSI for BTC/USD is now below the 50 level.
Major Support Levels – $18,700, followed by $18,550.
Major Resistance Levels – $19,050, $19,300 and $19,500.
Why this matters
This bitcoin story adds another data point to the current market tape and is useful when read alongside nearby source coverage.
Original source
Read on NewsBTCRelated market context

Bitcoin Price Prediction: ETF Bouncing, Bitwise Sees Bottom and Huge Adoption
Bitcoin is trading near $64,700, up about 4% over the past day after rebounding from an ETF-driven selloff. The latest Bitcoin pri...

Near $65K, Bitcoin’s 2 year social media drop off is hiding a $4.3 billion whale exit and a new class of buyers
Crypto discussion across X, Reddit, Telegram, and other major social channels has fallen to its second-lowest daily level since Oc...

Ripple Joins x402 Foundation to Advance RLUSD AI Payments: Will XRP Price Benefit?
XRP price prediction is back in focus as it trades around $1.11, up about 3.6% over the past 24 hours. It remains pinned beneath a...

Bitcoin (BTC) Price Prediction: $65.6K Liquidity Sweep Could Decide Whether BTC Retests $60K or Breaks Higher
While short-term technical indicators suggest buyers are attempting to regain momentum, traders remain cautious as mixed signals a...

Bitcoin pushes toward $65,000 on US inflation relief that may already be fading
Bitcoin approached $65,000 on July 14 as a sharper-than-expected slowdown in US inflation weakened the case for another near-term...

Ethereum Research Thread Puts Sybil Resistance Back In Focus For Decentralized Networks
Ethereum Research Thread Puts Sybil Resistance Back In Focus For Decentralized Networks is a useful reminder that crypto coverage...