TA: Bitcoin Price Reclaims $20K, Why This Could Be The Start of Larger Rally
Bitcoin price gained pace for a move above $20,000 against the US Dollar. BTC is showing positive signs and might rise further above $20,500. Bitcoin started a steady increase above the $19,200 and $19,500 resistance lev...
Archive context
Older archive item. Useful for background and entity history, but not a fresh market-moving signal.

Bitcoin price gained pace for a move above $20,000 against the US Dollar. BTC is showing positive signs and might rise further above $20,500.
- Bitcoin started a steady increase above the $19,200 and $19,500 resistance levels.
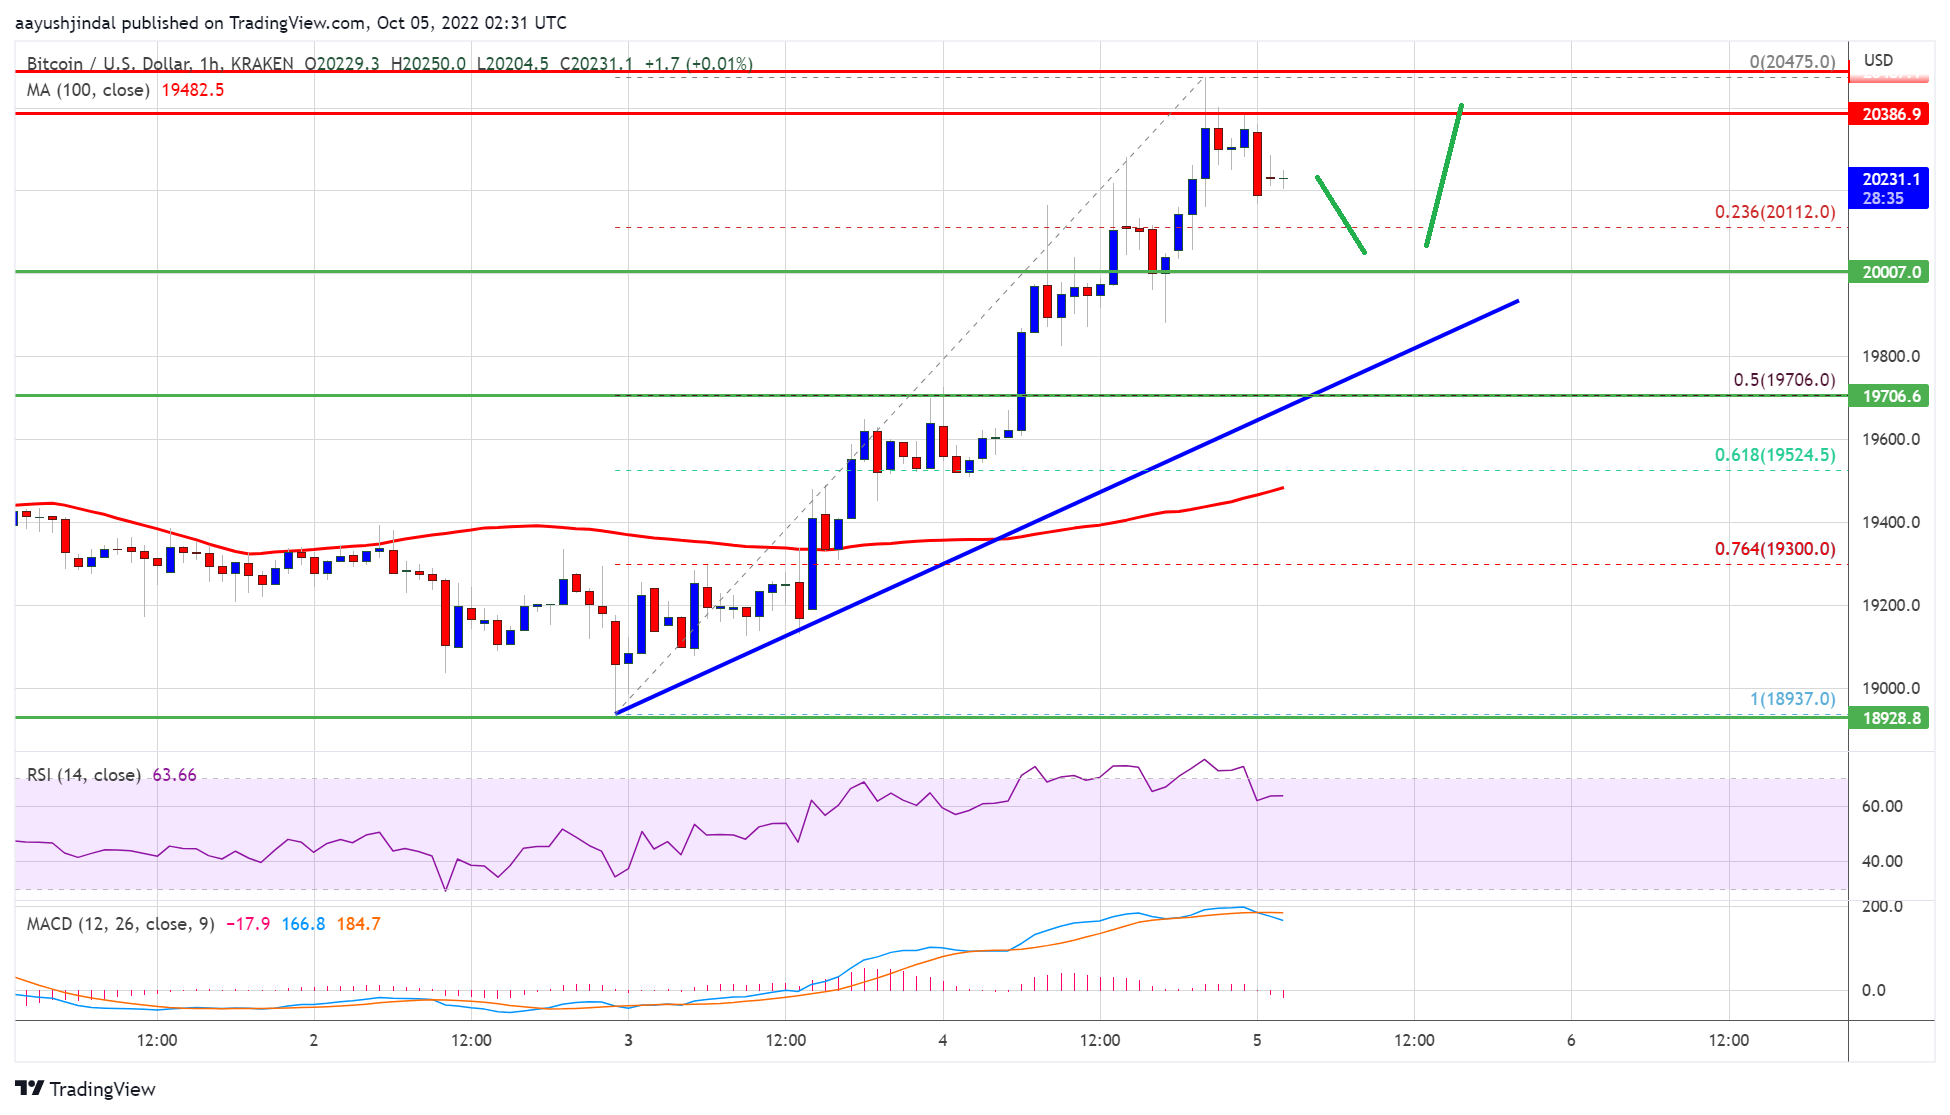
- The price is trading above $20,000 and the 100 hourly simple moving average.
- There is a connecting bullish trend line forming with support near $20,000 on the hourly chart of the BTC/USD pair (data feed from Kraken).
- The pair is gaining pace and might rally further above the $20,500 level.
Bitcoin price formed a base above the $19,000 level and started a steady increase. BTC was able to clear the $19,500 and $19,650 resistance levels.
The bulls were able to pump the price above the $20,000 resistance zone. The price traded as high as $20,475 and the price is now correcting gains. It is trading above $20,000 and the 100 hourly simple moving average. Bitcoin is now slowly moving lower below $20,400.
It is trading well above the 23.6% Fib retracement level of the upward move from the $18,937 swing low to $20,475 high. There is also a connecting bullish trend line forming with support near $20,000 on the hourly chart of the BTC/USD pair.
Source: BTCUSD on TradingView.com
On the upside, an immediate resistance is near the $20,450 level. The next major resistance sits near the $20,500 zone. A clear move above the $20,500 resistance might start another increase. In the stated case, the price could even surpass the $21,200 resistance zone. The next major resistance is near the $22,500 zone.
Dips Limited in BTC?If bitcoin fails to rise above the $20,500 resistance zone, it could start a downside correction. An immediate support on the downside is near the $20,100 zone.
The next major support is near the $20,000 zone and the trend line. A downside break below the trend line might send the price towards $19,700. It is near the 50% Fib retracement level of the upward move from the $18,937 swing low to $20,475 high. The main support is near $19,500, below which the price might drop to $19,200.
Technical indicators:
Hourly MACD – The MACD is now gaining pace in the bullish zone.
Hourly RSI (Relative Strength Index) – The RSI for BTC/USD is now above the 50 level.
Major Support Levels – $20,100, followed by $20,000.
Major Resistance Levels – $20,500, $21,200 and $22,500.
Why this matters
This bitcoin story adds another data point to the current market tape and is useful when read alongside nearby source coverage.
Original source
Read on NewsBTCRelated market context

XRP’s $1 rebound faces holders trapped above $2
Glassnode reported that XRP holders who bought between 6 and 12 months ago have an average cost basis near $2.22, roughly 52% abov...

Ripple Joins x402 Foundation to Advance RLUSD AI Payments: Will XRP Price Benefit?
XRP price prediction is back in focus as it trades around $1.11, up about 3.6% over the past 24 hours. It remains pinned beneath a...

Crypto News, July 15: Bitcoin and Ethereum Price Jump on Softer CPI and Japan Bitcoin ETF
Bitcoin and Ethereum price climbed after cooler-than-expected U.S. inflation data improved market sentiment. Just hours after, a J...

Bitcoin (BTC) Price Prediction: $65.6K Liquidity Sweep Could Decide Whether BTC Retests $60K or Breaks Higher
While short-term technical indicators suggest buyers are attempting to regain momentum, traders remain cautious as mixed signals a...

Ethereum Research Thread Puts Sybil Resistance Back In Focus For Decentralized Networks
Ethereum Research Thread Puts Sybil Resistance Back In Focus For Decentralized Networks is a useful reminder that crypto coverage...

XRP Price Prediction: Key Metrics Point to a Crash
XRP prediction chatter is heating up even as the price slips, which is usually when markets like to play tricks. XRP trades at aro...