TA: Bitcoin Price Resilience Suggests A Fresh Rally is Imminent: Here’s Why
Bitcoin found a strong buying interest near $18,500 against the US Dollar. BTC is recovering and there could be a fresh increase above the $20,000 resistance. Bitcoin remained stable and the bulls again protected the $18...
Archive context
Older archive item. Useful for background and entity history, but not a fresh market-moving signal.

Bitcoin found a strong buying interest near $18,500 against the US Dollar. BTC is recovering and there could be a fresh increase above the $20,000 resistance.
- Bitcoin remained stable and the bulls again protected the $18,500 support zone.
- The price is trading above $19,000 and the 100 hourly simple moving average.
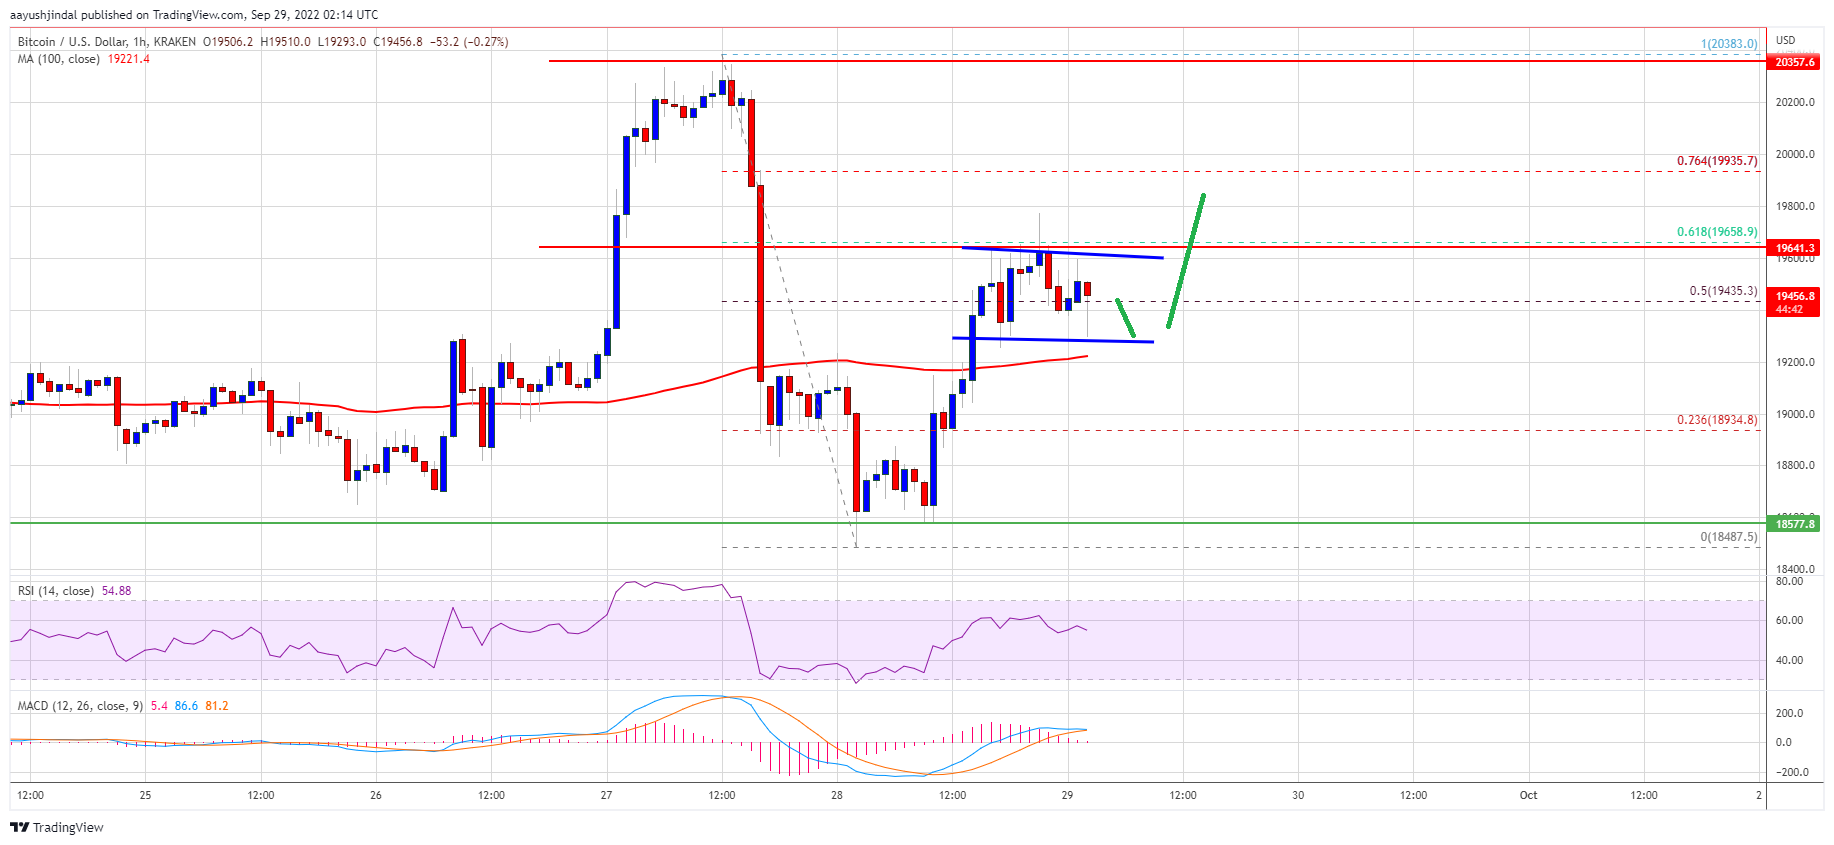
- There is a short-term channel forming with support near $19,280 on the hourly chart of the BTC/USD pair (data feed from Kraken).
- The pair could start a fresh rally if there is a clear move above the $19,650 resistance zone.
Bitcoin price declined heavily from well above the $20,000 pivot level. BTC dropped below the $19,000 level, but the bulls were active near the $18,500 support zone.
It seems like the price is well supported near the $18,500 zone and there are multiple rejections visible around the same area. The price is now rising and there was a move above the $19,000 resistance zone. The bulls pushed the price above the 50% Fib retracement level of the downward move from the $20,383 swing high to $18,487 low.
Bitcoin price is now trading above $19,000 and the 100 hourly simple moving average. There is also a short-term channel forming with support near $19,280 on the hourly chart of the BTC/USD pair.
On the upside, an immediate resistance is near the $19,600 level. The next major resistance sits near the $19,650 zone. It is close to the 61.8% Fib retracement level of the downward move from the $20,383 swing high to $18,487 low.
Source: BTCUSD on TradingView.com
A close above the $19,650 level might start a fresh increase. In the stated case, the price could rise towards $20,000. Any more gains might lead the price higher towards the $20,500 resistance zone.
Another Decline in BTC?If bitcoin fails to recover above the $19,650 resistance zone, it could start a fresh decline. An immediate support on the downside is near the $19,280 zone and the channel trend line.
The next major support is near the $19,200 zone and the 100 hourly SMA. The main support is near $19,000. Any more losses might call for a drop towards the $18,500 support zone in the coming sessions.
Technical indicators:
Hourly MACD – The MACD is now losing pace in the bullish zone.
Hourly RSI (Relative Strength Index) – The RSI for BTC/USD is now above the 50 level.
Major Support Levels – $19,200, followed by $19,000.
Major Resistance Levels – $19,650, $20,000 and $20,500.
Why this matters
This bitcoin story adds another data point to the current market tape and is useful when read alongside nearby source coverage.
Original source
Read on NewsBTCRelated market context

Crypto News, July 15: Bitcoin and Ethereum Price Jump on Softer CPI and Japan Bitcoin ETF
Bitcoin and Ethereum price climbed after cooler-than-expected U.S. inflation data improved market sentiment. Just hours after, a J...

Ethereum Research Thread Puts Sybil Resistance Back In Focus For Decentralized Networks
Ethereum Research Thread Puts Sybil Resistance Back In Focus For Decentralized Networks is a useful reminder that crypto coverage...

Bitcoin Price Prediction: ETF Bouncing, Bitwise Sees Bottom and Huge Adoption
Bitcoin is trading near $64,700, up about 4% over the past day after rebounding from an ETF-driven selloff. The latest Bitcoin pri...

XRP’s $1 rebound faces holders trapped above $2
Glassnode reported that XRP holders who bought between 6 and 12 months ago have an average cost basis near $2.22, roughly 52% abov...

Bitcoin (BTC) Price Prediction: $65.6K Liquidity Sweep Could Decide Whether BTC Retests $60K or Breaks Higher
While short-term technical indicators suggest buyers are attempting to regain momentum, traders remain cautious as mixed signals a...

FIFA World Cup 2026 fan zones highlight how major sports events are skipping crypto sponsorships
The absence of crypto sponsorships at major sports events like the FIFA World Cup 2026 indicates a shift in market dynamics and tr...