TA: Bitcoin Price Stuck Below Resistance, Why Bears Could Aim More Losses
Bitcoin started an upside correction above $19,000 against the US Dollar. BTC is now facing a strong resistance near the $19,350 and $19,500 levels. Bitcoin is attempting an upside correction above the $19,000 level. The...
Archive context
Older archive item. Useful for background and entity history, but not a fresh market-moving signal.

Bitcoin started an upside correction above $19,000 against the US Dollar. BTC is now facing a strong resistance near the $19,350 and $19,500 levels.
- Bitcoin is attempting an upside correction above the $19,000 level.
- The price is still trading below $19,500 and the 100 hourly simple moving average.
- There is a major bearish trend line forming with resistance near $19,420 on the hourly chart of the BTC/USD pair (data feed from Kraken).
- The pair must clear the trend line and the 100 hourly SMA to continue higher towards $20,500.
Bitcoin price started a short-term upside correction from the $18,223 low. BTC was able to climb above the $18,800 and $19,000 levels. It even cleared the $19,350 resistance zone.
However, the price faced a strong resistance near the $19,650 level and the 100 hourly simple moving average. A high was formed near $19,678 and the price started a fresh decline. There was a move below the $19,500 and $19,400 levels.
Bitcoin price traded below the 50% Fib retracement level of the upward move from the $18,223 swing low to $19,678 high. The bulls are now protecting the $18,800 support zone.
The 61.8% Fib retracement level of the upward move from the $18,223 swing low to $19,678 high is acting as a support. On the upside, an immediate resistance is near the $19,200 level. The next major resistance sits near the $19,350 level.
Source: BTCUSD on TradingView.com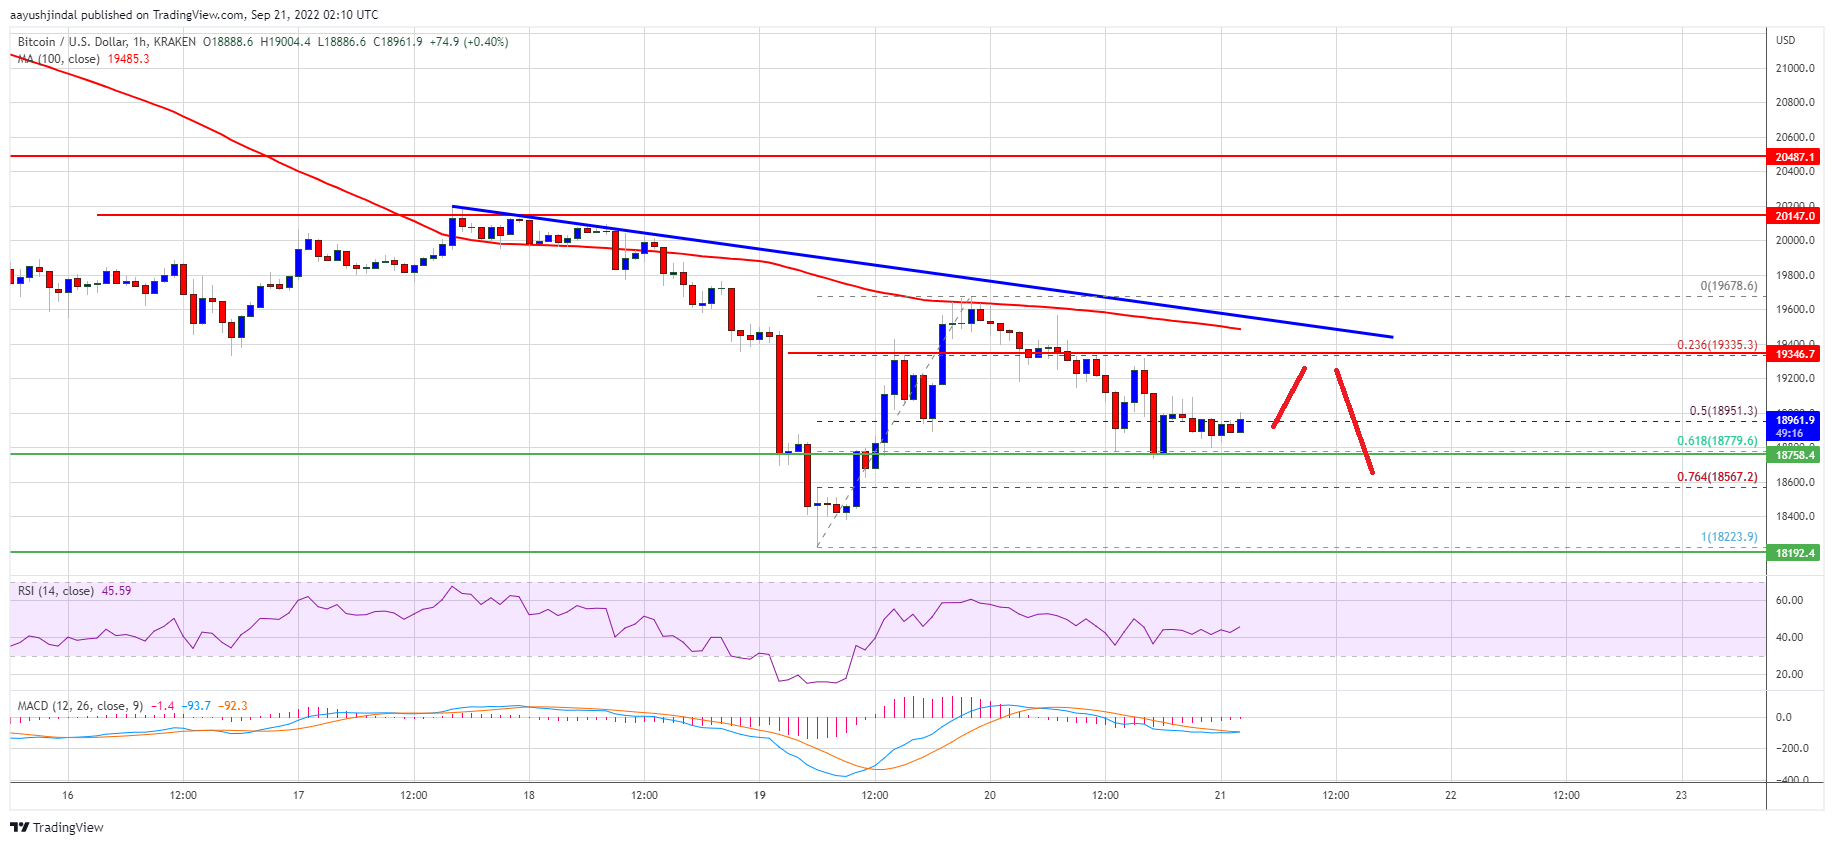
There is also a major bearish trend line forming with resistance near $19,420 on the hourly chart of the BTC/USD pair. A clear move above the trend line, the 100 hourly simple moving average, and $19,500 could open the doors for a move towards the $20,000 level. Any more gains might send the price towards the $20,500 resistance zone.
Fresh Decline in BTC?If bitcoin fails to continue higher above the $19,350 resistance zone, it could start a fresh decline. An immediate support on the downside is near the $18,800 zone.
The next major support is near the $18,550 level. A clear move below the $18,550 zone could set the pace for a larger decline. In the stated case, the price may even decline below the $18,223 swing low.
Technical indicators:
Hourly MACD – The MACD is now losing pace in the bullish zone.
Hourly RSI (Relative Strength Index) – The RSI for BTC/USD is now near the 50 level.
Major Support Levels – $18,800, followed by $18,550.
Major Resistance Levels – $19,200, $19,350 and $19,500.
Why this matters
This bitcoin story adds another data point to the current market tape and is useful when read alongside nearby source coverage.
Original source
Read on NewsBTCRelated market context

Bitcoin Price Prediction: ETF Bouncing, Bitwise Sees Bottom and Huge Adoption
Bitcoin is trading near $64,700, up about 4% over the past day after rebounding from an ETF-driven selloff. The latest Bitcoin pri...

Bitcoin (BTC) Price Prediction: $65.6K Liquidity Sweep Could Decide Whether BTC Retests $60K or Breaks Higher
While short-term technical indicators suggest buyers are attempting to regain momentum, traders remain cautious as mixed signals a...

XRP’s $1 rebound faces holders trapped above $2
Glassnode reported that XRP holders who bought between 6 and 12 months ago have an average cost basis near $2.22, roughly 52% abov...

Ethereum Price Approaches $2,000 as Foundation Team Spins Out EthSystems
Ethereum price is heating up as it pounces higher above $1,850, gaining more than 5% over the past day. The $2,000 level is finall...

Ripple Joins x402 Foundation to Advance RLUSD AI Payments: Will XRP Price Benefit?
XRP price prediction is back in focus as it trades around $1.11, up about 3.6% over the past 24 hours. It remains pinned beneath a...

Bitcoin pushes toward $65,000 on US inflation relief that may already be fading
Bitcoin approached $65,000 on July 14 as a sharper-than-expected slowdown in US inflation weakened the case for another near-term...