TA: Bitcoin Price Stuck In Range, Why BTC Is Still At Major Risk of Breakdown
Bitcoin is struggling to settle above $20,500 against the US Dollar. BTC could decline heavily if there is a clear move below the $19,500 support zone. Bitcoin is stuck near the $20,000 zone and trading below the $20,500...
Archive context
Older archive item. Useful for background and entity history, but not a fresh market-moving signal.

Bitcoin is struggling to settle above $20,500 against the US Dollar. BTC could decline heavily if there is a clear move below the $19,500 support zone.
- Bitcoin is stuck near the $20,000 zone and trading below the $20,500 resistance.
- The price is now trading below the $20,000 level and the 100 hourly simple moving average.
- There is a short-term rising channel forming with support near $19,750 on the hourly chart of the BTC/USD pair (data feed from Kraken).
- The pair could accelerate lower if there is a clear move below the $19,600 and $19,500 levels.
Bitcoin price traded in a range below the $20,500 and $20,550 resistance levels. BTC failed on many occasions to clear the $20,500 resistance zone.
At the same time, the bulls were active above the $19,500 support zone. The recent low was formed near $19,600 and the price is now moving higher in the range. There was a minor increase above the $19,750 resistance zone. The price climbed above the 23.6% Fib retracement level of the recent decline from the $20,397 swing high to $19,600 low.
Bitcoin price is now trading below the $20,000 level and the 100 hourly simple moving average. There is also a short-term rising channel forming with support near $19,750 on the hourly chart of the BTC/USD pair.
On the upside, an immediate resistance is near the $19,900 level and the 100 hourly simple moving average. The next major resistance sits near the $20,000 level. It is near the 50% Fib retracement level of the recent decline from the $20,397 swing high to $19,600 low.
Source: BTCUSD on TradingView.com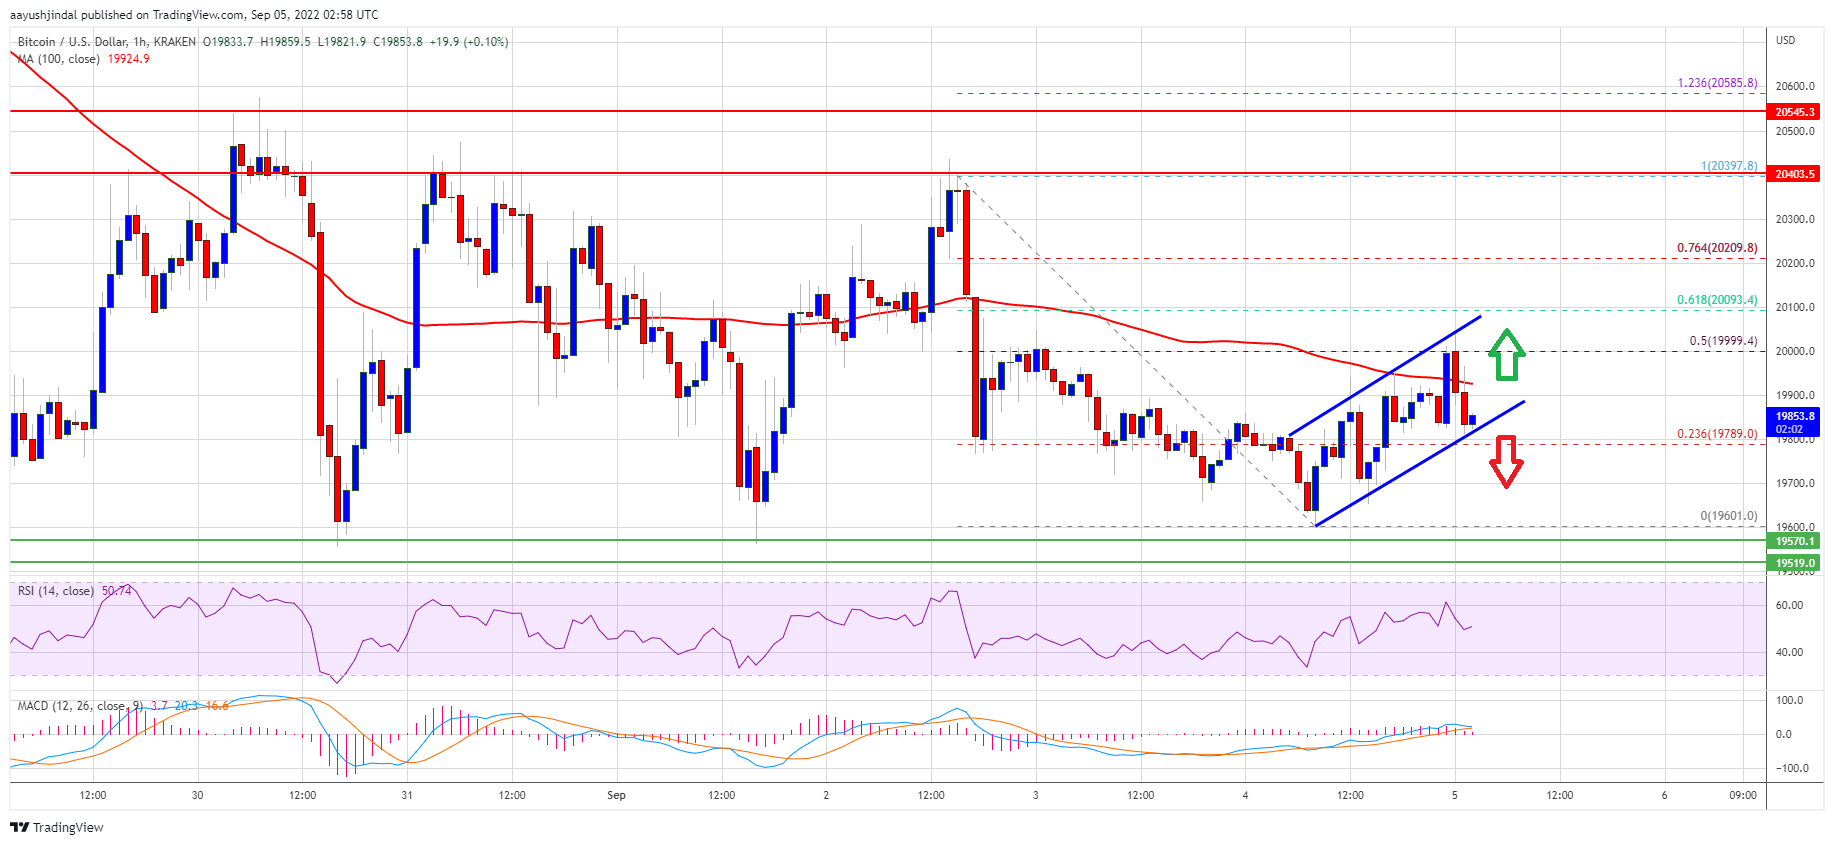
A clear move above the $20,000 resistance might send the price towards $20,500. Any more gains might start a steady move towards the $21,200 resistance zone.
Downside Break in BTC?If bitcoin fails to clear the $20,500 resistance zone, it could start another decline. An immediate support on the downside is near the $19,750 zone.
The next major support sits near the $19,600 level. The main support sits near the $19,500 level. A break below the $19,500 support might spark a sharp decline towards $18,800. Any more losses might call for a move to $18,500 in the near term.
Technical indicators:
Hourly MACD – The MACD is now losing pace in the bullish zone.
Hourly RSI (Relative Strength Index) – The RSI for BTC/USD is now above the 50 level.
Major Support Levels – $19,750, followed by $19,500.
Major Resistance Levels – $20,000, $20,350 and $20,500.
Why this matters
This bitcoin story adds another data point to the current market tape and is useful when read alongside nearby source coverage.
Original source
Read on NewsBTCRelated market context

Ethereum Price Approaches $2,000 as Foundation Team Spins Out EthSystems
Ethereum price is heating up as it pounces higher above $1,850, gaining more than 5% over the past day. The $2,000 level is finall...

Crypto News, July 15: Bitcoin and Ethereum Price Jump on Softer CPI and Japan Bitcoin ETF
Bitcoin and Ethereum price climbed after cooler-than-expected U.S. inflation data improved market sentiment. Just hours after, a J...

BitMine made $46 million staking Ethereum then lost twice that betting on it
BitMine's push to turn one of the world's largest corporate Ethereum holdings into a source of recurring income generated nearly $...

Bitcoin Price Prediction: ETF Bouncing, Bitwise Sees Bottom and Huge Adoption
Bitcoin is trading near $64,700, up about 4% over the past day after rebounding from an ETF-driven selloff. The latest Bitcoin pri...

Bitcoin (BTC) Price Prediction: $65.6K Liquidity Sweep Could Decide Whether BTC Retests $60K or Breaks Higher
While short-term technical indicators suggest buyers are attempting to regain momentum, traders remain cautious as mixed signals a...

Solana Holds Near $77 As Traders Look For Real Demand Behind The Bounce
Crypto does not move on one kind of catalyst. Some days it is price, some days it is policy, and some days it is infrastructure. S...