TA: Bitcoin Price Takes Hit, Why BTC Remains at Risk of More Losses
Bitcoin price started a fresh decline from the $24,250 resistance zone against the US Dollar. BTC declined below $23,000 and remains at a risk of more losses. Bitcoin started a fresh decline below the $23,500 support zon...
Archive context
Older archive item. Useful for background and entity history, but not a fresh market-moving signal.

Bitcoin price started a fresh decline from the $24,250 resistance zone against the US Dollar. BTC declined below $23,000 and remains at a risk of more losses.
- Bitcoin started a fresh decline below the $23,500 support zone.
- The price is now trading below the $23,500 level and the 100 hourly simple moving average.
- There was a break below a major bullish trend line with support near $23,320 on the hourly chart of the BTC/USD pair (data feed from Kraken).
- The pair must clear the $23,250 resistance to start a fresh increase in the near term.
Bitcoin price struggled to gain pace above the $24,000 resistance zone. The price formed a top near $24,285 and started a fresh decline.
There was a clear move below the $23,800 and $23,500 support levels. The bears pushed the pair below the 61.8% Fib retracement level of the upward move from the $22,846 swing low to $24,286 high. Besides, there was a break below a major bullish trend line with support near $23,320 on the hourly chart of the BTC/USD pair.
Bitcoin price is now trading below the $23,500 level and the 100 hourly simple moving average. It is now consolidating above the key $22,650 support zone.
Source: BTCUSD on TradingView.comOn the upside, an immediate resistance is near the $23,250 level. The next key resistance is near the $23,500 zone. A close above the $23,500 resistance zone could start a steady increase. In the stated case, the price may perhaps rise clear the $24,000 resistance.
Downside Break in BTC?If bitcoin fails to clear the $23,500 resistance zone, it could continue to mov down. An immediate support on the downside is near the $22,650 level.
The next major support now sits near the $22,500 level. A close below the $22,500 level might start a move towards $22,000. If the bears remain in action, there is a risk of a move towards the $21,500 level in the coming sessions. Any more losses might send the price towards $20,500 level.
Technical indicators:
Hourly MACD – The MACD is now gaining pace in the bearish zone.
Hourly RSI (Relative Strength Index) – The RSI for BTC/USD is now well below the 50 level.
Major Support Levels – $22,650, followed by $22,500.
Major Resistance Levels – $23,250, $23,500 and $24,000.
Why this matters
This bitcoin story adds another data point to the current market tape and is useful when read alongside nearby source coverage.
Original source
Read on NewsBTCRelated market context

Ethereum (ETH) Price Prediction: Whale Rotates $155M Into ETH as Longs Surge Near $2,500
Ethereum is trying to stabilize after another volatile stretch, with price returning toward the mid-$2,400 region while several po...

Bitcoin (BTC) Price Prediction: $74K Liquidity Gap Puts $80K Support to the Test
Meanwhile, data from Glassnode and Fasanara Digital show that traditional financial assets are capturing a growing share of deriva...
Tether Wins Mining Industry Support For Its Open Automation Toolkit
Tether is trying to make Bitcoin mining equipment easier to operate as one system. Its October 24 announcement brings 15 industry...
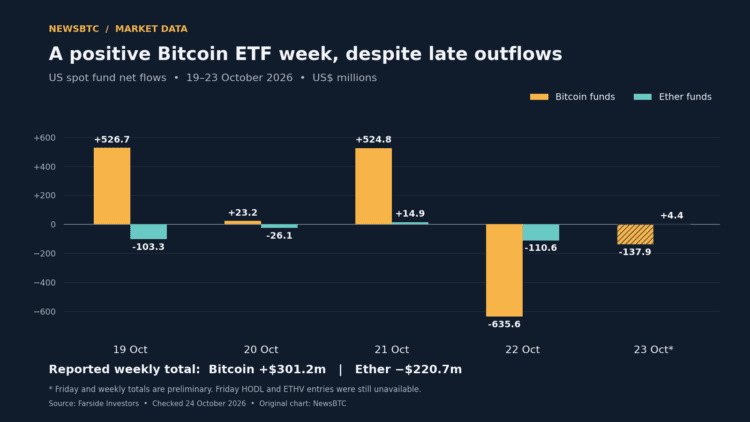
Bitcoin ETF Week Stays Positive After Nearly $774 Million In Late Outflows
TL;DR: Farside’s preliminary figures show US Bitcoin funds retaining a $301.2 million weekly inflow despite two days of withdrawal...

Lido Puts Liquidity Buffers At The Center Of Ethereum ETP Yield Debate
An Ethereum investment product can advertise staking exposure without putting every unit of its ETH to work. Lido’s October 23 com...

Lido Opens Higher-Balance Ethereum Validators With A Deliberately Small Start
Lido has opened a permissionless route to Ethereum validators that can hold much larger effective balances, but the first allocati...