TA: Bitcoin Price Won’t Go Down Quietly: Key Supports To Watch
Bitcoin extended losses below the $23,650 support zone against the US Dollar. BTC must stay above $23,200 to avoid more losses in the near term. Bitcoin remained in a bearish zone and traded below the $23,650 support. Th...
Archive context
Older archive item. Useful for background and entity history, but not a fresh market-moving signal.

Bitcoin extended losses below the $23,650 support zone against the US Dollar. BTC must stay above $23,200 to avoid more losses in the near term.
- Bitcoin remained in a bearish zone and traded below the $23,650 support.
- The price is now trading below the $23,650 level and the 100 hourly simple moving average.
- There is a connecting bearish trend line forming with resistance near $24,000 on the hourly chart of the BTC/USD pair (data feed from Kraken).
- The pair could extend losses if there is a clear move below the $23,200 support in the near term.
Bitcoin price failed to stay in a positive zone above the $24,000 level. BTC started another decline and traded below the $23,650 support zone.
There was a clear move below the $23,500 level and the 100 hourly simple moving average. Finally, the price found support near the $23,200 zone. A low was formed near $23,193 and the price is now consolidating losses.
Bitcoin price is now trading below the $23,650 level and the 100 hourly simple moving average. On the upside, an immediate resistance is near the $23,500 level. It is near the 23.6% Fib retracement level of the recent decline from the $24,438 swing high to $23,193 low.
The first major resistance on the upside sits near the $23,800 level. It is near the 50% Fib retracement level of the recent decline from the $24,438 swing high to $23,193 low.
The main resistance is forming near the $24,000 zone and the 100 hourly simple moving average. There is also a connecting bearish trend line forming with resistance near $24,000 on the hourly chart of the BTC/USD pair. A close above the $23,800 and $24,000 resistance levels might start another increase.
Source: BTCUSD on TradingView.comIn the stated case, the price may perhaps climb towards the $24,500 resistance. Any more gains might send the price towards the $25,000 level.
More Losses in BTC?If bitcoin fails to clear the $24,000 resistance zone, it could continue to move down. An immediate support on the downside is near the $23,320 level.
The next major support now sits near the $23,200 level. A downside break and close below the $23,200 level might spark another decline. In the stated case, the price might decline towards the $22,750 level.
Technical indicators:
Hourly MACD – The MACD is now losing pace in the bearish zone.
Hourly RSI (Relative Strength Index) – The RSI for BTC/USD is now below the 50 level.
Major Support Levels – $23,320, followed by $23,200.
Major Resistance Levels – $23,500, $23,800 and $24,000.
Why this matters
This bitcoin story adds another data point to the current market tape and is useful when read alongside nearby source coverage.
Original source
Read on NewsBTCRelated market context

Ethereum (ETH) Price Prediction: Whale Rotates $155M Into ETH as Longs Surge Near $2,500
Ethereum is trying to stabilize after another volatile stretch, with price returning toward the mid-$2,400 region while several po...
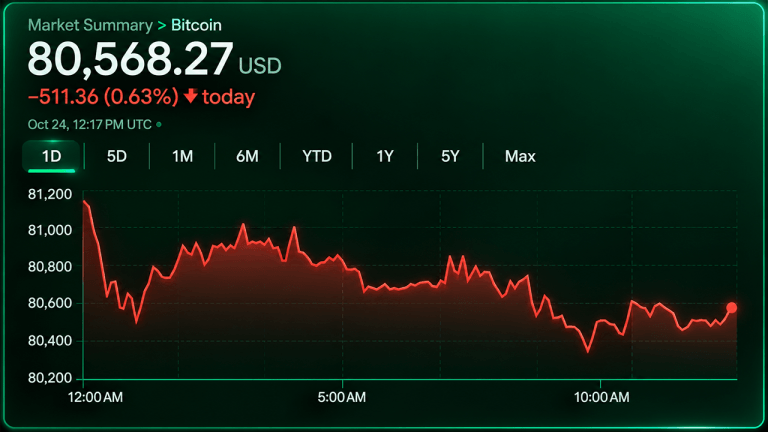
Bitcoin Price Faces $78K Threat as Sellers Hammer Key Support
Bitcoin’s price traded near $80,500 Saturday morning, Oct. 24, with sellers controlling the shorter time frames despite longer-ter...
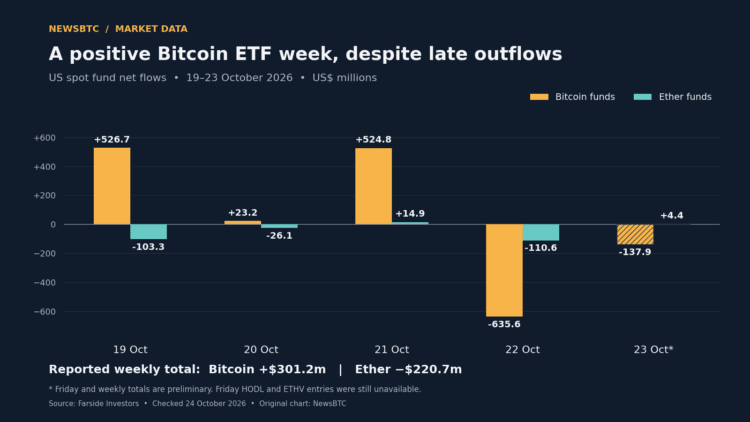
Bitcoin ETF Week Stays Positive After Nearly $774 Million In Late Outflows
TL;DR: Farside’s preliminary figures show US Bitcoin funds retaining a $301.2 million weekly inflow despite two days of withdrawal...

Ripple Legal Chief Raises Alarm Over Losses in New Crypto Offerings
Ripple’s legal chief Stuart Alderoty is calling for clearer project promises and issuer accountability amid concerns about losses...

Crypto Longs Lose $404 Million in Four Hours as Bitcoin Slips Below $80,000
Bitcoin's brief dip under $80,000 on 24 October 2026 triggered $404 million in long liquidations within four hours. Here is what t...

Bitcoin Slides Below $80,000 as US Evacuates Middle East Personnel on Iranian Threat
Bitcoin slid to $79,700, its weakest in over a month, as the US evacuated Middle East personnel on Iranian attack threats. Ether,...