This Historic Bitcoin On-Chain Support Level Is Still Not Lost
On-chain data shows the historical 20-Day MA Bitcoin aSOPR support level has continued to hold so far. Bitcoin 20-Day MA aSOPR Rebounds Off Historical Support Line As pointed out by an analyst in a CryptoQuant post, the...
Archive context
Older archive item. Useful for background and entity history, but not a fresh market-moving signal.

On-chain data shows the historical 20-Day MA Bitcoin aSOPR support level has continued to hold so far.
Bitcoin 20-Day MA aSOPR Rebounds Off Historical Support LineAs pointed out by an analyst in a CryptoQuant post, the BTC aSOPR recently retested its 8-year old support.
The “Spent Output Profit Ratio” (or SOPR in short) is an indicator that tells us whether the average Bitcoin investor is selling at a profit or at a loss right now.
When the value of this metric is greater than 1, it means the overall market is moving coins at some profit currently.
On the other hand, values of the indicator less than the threshold suggest holders as a whole are realizing some loss with their selling at the moment.
Naturally, SOPR values exactly equal to 1 imply the investors are just breaking even on their investment right now.
“Adjusted SOPR” (aSOPR) is a modified version of this metric that excludes from the data any selling of coins that was done within 1 hour of first acquiring said coins.
Here is a chart that shows the trend in the 20-day moving average Bitcoin aSOPR over the last several years:
Looks like the 20-day MA value of the metric has sharply declined in recent days | Source: CryptoQuantAs you can see in the above graph, the 20-day MA aSOPR rapidly went down following the FTX crash, and touched a low of 0.93 just a week or so ago.
This level was the same as the one seen during the lows of the previous bear markets, and each of the touches in those bears launched the metric back up.
The support line has now been active since 2014, and in the 8 years so far the indicator has never seen any actual dip below it.
Since the retest of this support level a week ago, the metric has already bounced back up, suggesting that this important support line is still holding right now.
However, it’s uncertain whether this successful retest means the bottom is now in. Back In the 2018/19 bear, it was indeed the case, but in 2014/15 it took two touches of the line before the real bottom formed.
BTC PriceAt the time of writing, Bitcoin’s price floats around $16.8k, up 3% in the last week. Over the past month, the crypto has lost 18% in value.
The below chart shows the trend in the BTC price over the last five days.
The value of the crypto seems to have been moving sideways since the surge | Source: BTCUSD on TradingView Featured image from André François McKenzie on Unsplash.com, charts from TradingView.com, CryptoQuant.comWhy this matters
This bitcoin story adds another data point to the current market tape and is useful when read alongside nearby source coverage.
Original source
Read on NewsBTCRelated market context

XRP Price Prediction: Key Metrics Point to a Crash
XRP prediction chatter is heating up even as the price slips, which is usually when markets like to play tricks. XRP trades at aro...
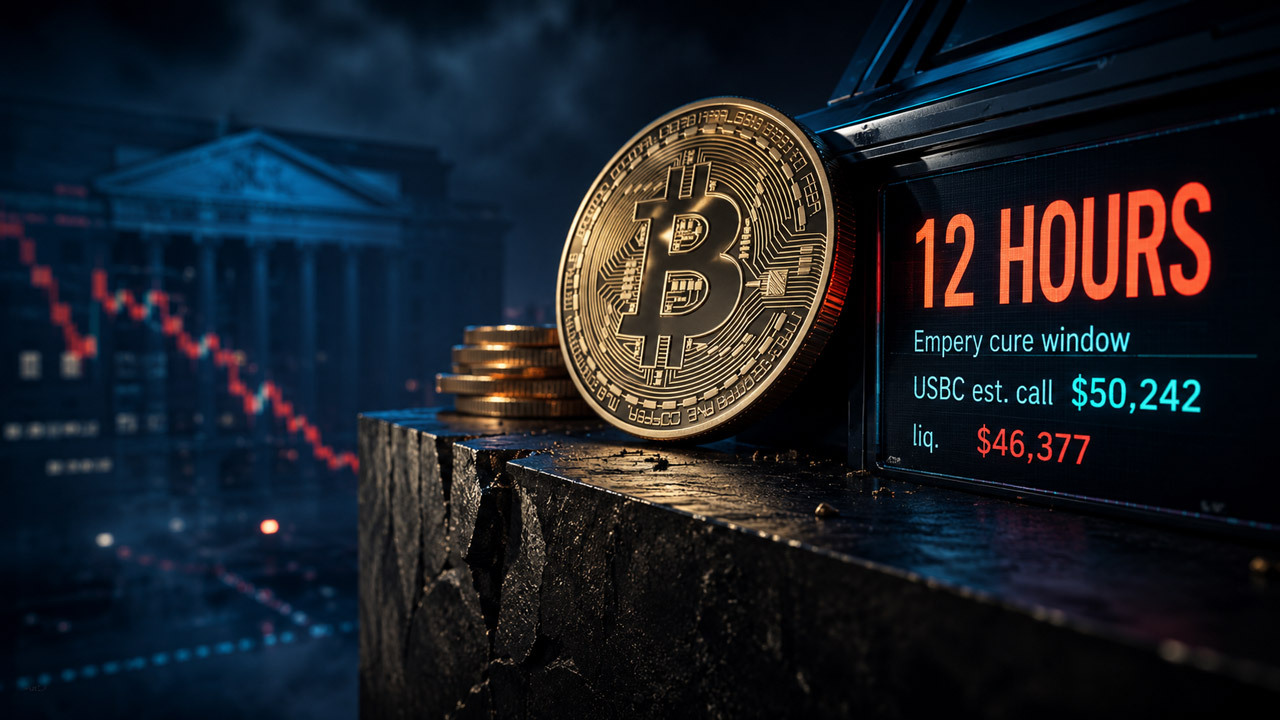
Bitcoin treasuries already faced two collateral calls in 2026 and some loans can liquidate after just 12 hours
Public companies' Bitcoin treasury reserves become something very different once pledged to lenders. They become collateral, measu...

Chainalysis Adds Automatic Stablecoin Support As Compliance Teams Face Token Sprawl
Chainalysis Adds Automatic Stablecoin Support As Compliance Teams Face Token Sprawl is a useful reminder that crypto coverage is n...

XRP’s $1 rebound faces holders trapped above $2
Glassnode reported that XRP holders who bought between 6 and 12 months ago have an average cost basis near $2.22, roughly 52% abov...

Banks are building the rails to profit from 13.9 million BTC they do not own
Strategy's new Bitcoin Banking Adoption Index gives 25 major banks and financial institutions an overall 32% score based on activi...

OFAC FirstVPN Sanctions Show Crypto Enforcement Is Moving Up The Infrastructure Stack
OFAC FirstVPN Sanctions Show Crypto Enforcement Is Moving Up The Infrastructure Stack is a useful reminder that crypto coverage is...