Trader Who Called 2018 Crypto Collapse Issued Bitcoin (BTC) Warning
According to the latest reports, Veteran trader Peter Brandt is issuing traders a warning about a particular Bitcoin (BTC) pattern he’s seeing on the charts. Brandt, who became a well-known crypto analyst after correctly...
Archive context
Older archive item. Useful for background and entity history, but not a fresh market-moving signal.

According to the latest reports, Veteran trader Peter Brandt is issuing traders a warning about a particular Bitcoin (BTC) pattern he’s seeing on the charts.
Brandt, who became a well-known crypto analyst after correctly calling Bitcoin’s 2018 collapse.
That BTC could be in a pennant trading pattern, which would indicate Bitcoin’s downward price move is likely to continue.
“When it looks like a pennant and acts like a pennant it is often a pennant.”
Bitcoin is trading for $20,415 at the time of writing.
This would be a positive development for BTCBrandt said last week that it would be a positive development for BTC if the Bitcoin Dominance chart (BTC.D) manages to reach 50%.
“The BTC.D tracks how much of the total crypto market capitalization belongs to Bitcoin and has not reached 50% since July of 2021 when it bottomed out at around $30,000 before rallying to its all-time high at $69,000. Bitcoin Dominance currently sits around 42.45%.”
Brandt also notes that the US Dollar Index was recently trading at a 20-year high. He explained the following:
“The global debt market is denominated mostly in USDs which means payback must be in USD. In effect, the world banking system is short dollars.”
An important tant crypto analyst is comparing Bitcoin’s price action to one traditional stock to predict what’s next for BTC after a rocky last two months.
In a new strategy session, the anonymous host of InvestAnswers highlights automaker Tesla and discusses the significance of mean reversion. This is a metric that posits an asset’s price will eventually return to its long-term average.
“Let’s look at the pair. This is the Tesla-divided-by-Bitcoin pair, and you can see the price now is about 0.036. We are back at late 2020 levels. It’s like a big huge U.”
He continued and stated the following:
“Is mean reversion overdue? Looking at this chart, you’ll see the blue line, that’s the 200-day moving average. That’s about 0.024 and we’re currently trading at 0.036. While Tesla has remained flat over the last 12 months, Bitcoin has gotten clobbered down 70%.”
The post Trader Who Called 2018 Crypto Collapse Issued Bitcoin (BTC) Warning first appeared on CryptoGazette - Cryptocurrency News.Why this matters
This bitcoin story adds another data point to the current market tape and is useful when read alongside nearby source coverage.
Original source
Read on CryptoGazetteRelated market context

Bitcoin enters its best season after a 43% surge, with $147,000 suddenly on the math
Bitcoin is closing its strongest quarter since 2024 after leaving US stocks and gold far behind despite surging bond yields. The l...
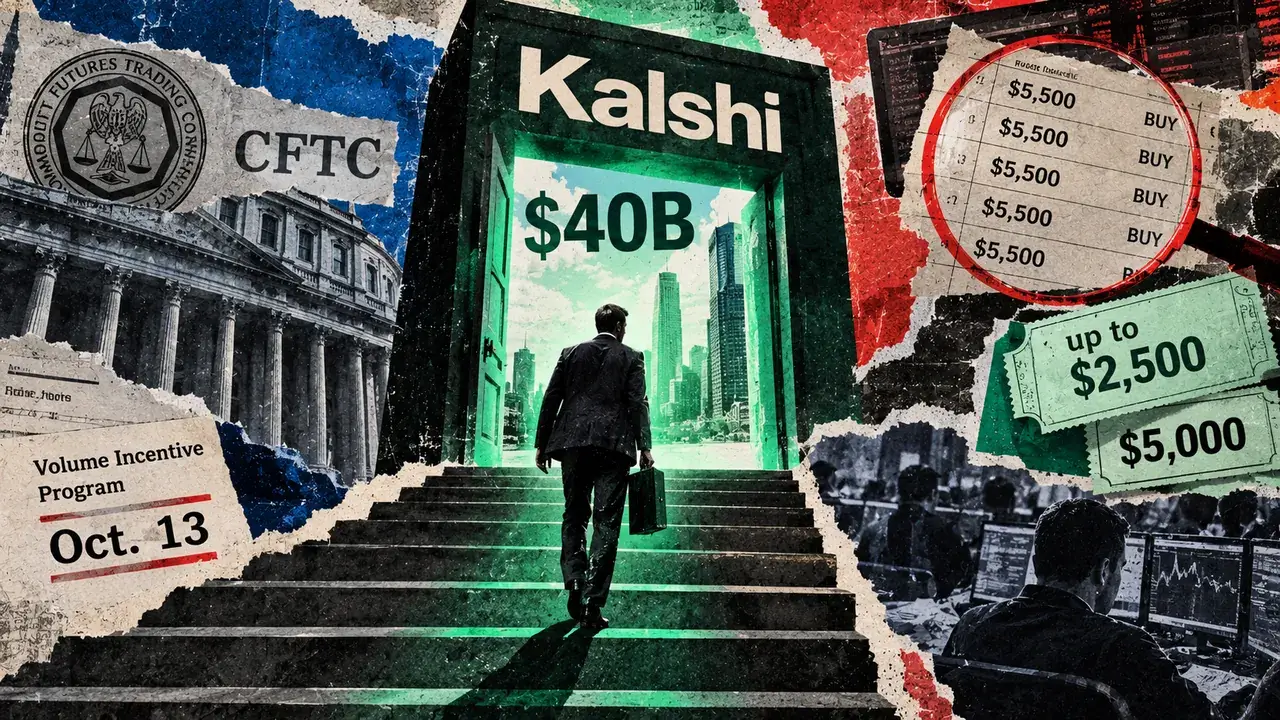
Kalshi’s $40 billion growth story hits tough questions about its trading volume
Kalshi is ending a trader-volume incentive program nearly a year early as scrutiny of activity in its crypto markets intensifies....

Republican Senator Steve Daines Releases Text of Proposed Crypto Tax Plan
Bitcoin Magazine Republican Senator Steve Daines Releases Text of Proposed Crypto Tax Plan Republican senator Steve Daines has rel...

Live Crypto Price Feeds and the Reliability Question Facing Traders
Why live crypto price dashboards on news homepages shape trading decisions, and how aggregation quality determines the numbers tra...

XRP Price Prediction: Ripple Targets 4 Straight Green Months in October
XRP price prediction is slightly bullish as it enters October at $1.50, and traders weigh whether September’s advance can extend t...

Most top NEAR traders on Hyperliquid hold short positions as the rally squeezes bears
The NEAR market's volatility highlights the risks of leveraged trading, as significant losses for shorts and gains for longs under...