Tron Price Outshines Bitcoin: Can TRX Keep Momentum and Rise?
Tron price is rising from the $0.1250 zone against the US Dollar. TRX is outperforming Bitcoin and could rise further above $0.1320. Tron is moving higher above the $0.1280 resistance level against the US dollar. The pri...
Archive context
Older archive item. Useful for background and entity history, but not a fresh market-moving signal.

Tron price is rising from the $0.1250 zone against the US Dollar. TRX is outperforming Bitcoin and could rise further above $0.1320.
- Tron is moving higher above the $0.1280 resistance level against the US dollar.
- The price is trading above $0.130 and the 100-hourly simple moving average.
- There is a key bullish trend line forming with support at $0.1305 on the hourly chart of the TRX/USD pair (data source from Kraken).
- The pair could continue to climb higher toward $0.1335 or even $0.1350.
Recently, Bitcoin and Ethereum saw a fresh decline below $60,000 and $2,700 respectively. However, Tron price remained stable above the $0.1250 support and climbed higher.
There was a decent move above the $0.1300 resistance zone. TRX price even tested the $0.1315 level. A high is formed at $0.1314 and the price is showing signs of more upsides. There is also a key bullish trend line forming with support at $0.1305 on the hourly chart of the TRX/USD pair.
The trend line is close to the 23.6% Fib retracement level of the upward move from the $0.1256 swing low to the $0.1314 high. The price is now trading above $0.1300 and the 100-hourly simple moving average. On the upside, an initial resistance is near the $0.1320 level
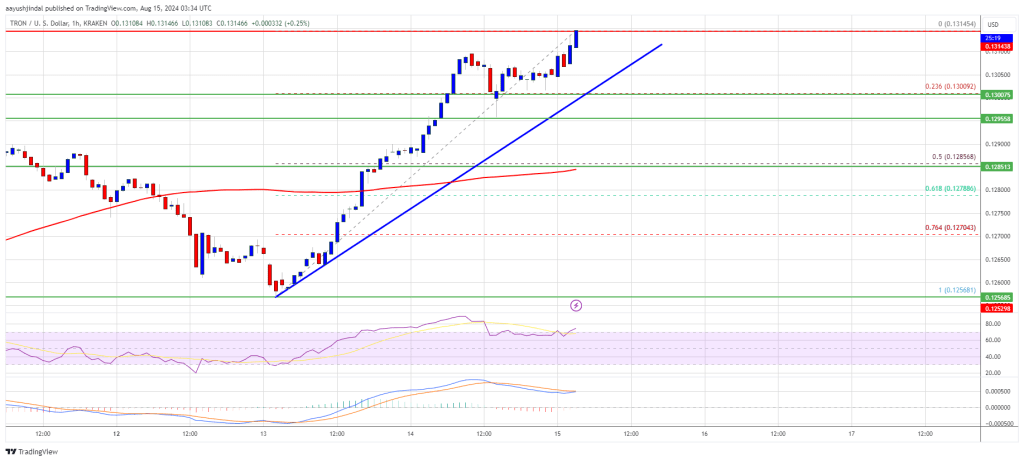
The first major resistance is near $0.1332, above which the price could accelerate higher. The next resistance is near $0.1350. A close above the $0.1350 resistance might send TRX further higher toward $0.1400. The next major resistance is near the $0.1420 level, above which the bulls are likely to aim for a larger increase toward $0.1450 in the near term.
Are Dips Supported in TRX?If TRX price fails to clear the $0.1320 resistance, it could start a downside correction. Initial support on the downside is near the $0.1300 zone and the trend line.
The first major support is near the $0.1285 level or the 50% Fib retracement level of the upward move from the $0.1256 swing low to the $0.1314 high, below which it could test $0.1280. Any more losses might send Tron toward the $0.1265 support in the coming sessions.
Technical Indicators
Hourly MACD – The MACD for TRX/USD is gaining momentum in the bullish zone.
Hourly RSI (Relative Strength Index) – The RSI for TRX/USD is currently above the 50 level.
Major Support Levels – $0.1300 and $0.1285.
Major Resistance Levels – $0.1320 and $0.1350.
Why this matters
This bitcoin story adds another data point to the current market tape and is useful when read alongside nearby source coverage.
Original source
Read on NewsBTCRelated market context
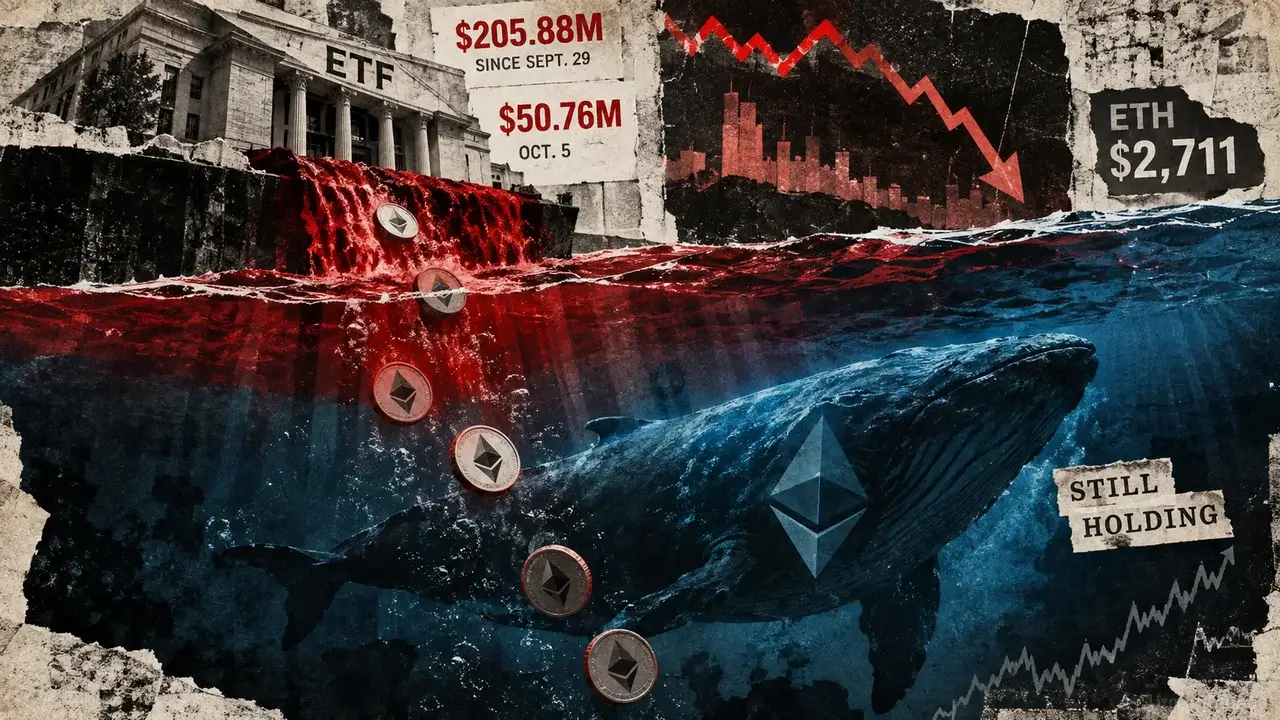
Ethereum bears keep selling but ETH price stays near $2,700 as US spot ETFs record $206M in outflows
Ethereum’s institutional demand is weakening around the same time derivatives positioning shows traders are selling aggressively w...

Google Gemini AI Predicts Chainlink (LINK) to Hit $300 by 2027
Google Gemini AI predicts that, assuming a full-blown crypto bull market returns and is turbocharged by a landmark catalyst, LINK...

Ethereum holds near $2,700 as $414.1 million in longs sit in liquidation zones
Ethereum trades near $2,700 as $148.3 million in crypto positions are liquidated and $414.1 million in ETH longs sit in liquidatio...

Microsoft Copilot AI Predicts Chainlink (LINK) Could Hit $100 in 2026
Microsoft Copilot AI predicts that in a world where Chainlink becomes the backbone of a major global settlement system, such as SW...

Mark Zuckerberg Meta AI Predicts Double-Digit XRP Price by 2026
Currently priced at approximately $1.50, Mark Zuckerberg’s Meta AI predicts that XRP could surge above $10 this year, a gain of ar...

XRP Price Prediction: Chart Mirroring 2016, Targeting $23
XRP trades at around the $1.50 price level, slightly down, but a long-range chart comparison points to a $23 prediction. The resem...