WATCH: Bitcoin Weekly Chart Fires Bottom Signals At Open | BTCUSD September 12, 2022
In this episode of NewsBTC’s daily technical analysis videos, we take a closer look at a variety of bullish signals in Bitcoin that fired with the most recent weekly open. However, the cryptocurrency market isn’t out of...
Archive context
Older archive item. Useful for background and entity history, but not a fresh market-moving signal.

In this episode of NewsBTC’s daily technical analysis videos, we take a closer look at a variety of bullish signals in Bitcoin that fired with the most recent weekly open. However, the cryptocurrency market isn’t out of the woods, as this week must confirm the signals with a strong close.
Take a look at the video below:
VIDEO: Bitcoin Price Analysis (BTCUSD): September 12, 2022Last night we had a weekly close in Bitcoin and have already added nearly 3% on top of around 16% from the lows swept during last week’s candle. As a result of the move, several bullish signals have fired on the candle open. But it is imperative that BTCUSD remains above current levels to confirm the signals with a full weekly candle close.
Examining The BTCUSD Weekly Buy SignalsThe weekly opened with a bullish crossover of the LMACD. Even a weekly candle close and a confirmed crossover can be a trap, as we have seen on the way down in BTCUSD weekly charts. However, it is where the crossover is happening from that is particularly notable.
Bullish crossovers of the LMACD during past bear markets at such a level have resulted in a long term bottom and sustained bull run. Momentum in both the 2018 and 2014 bear markets fell to the same level.
BTCUSD weekly is also working on a buy signal on the Relative Strength Index, according to the tool’s creator, J. Welles Wilder Jr. The buy signal is activated when the RSI falls below oversold conditions, then rises from below the threshold.
If at the next pullback, the RSI doesn’t revisit oversold conditions, we have one important factor in generating the buy signal. The RSI must then make a higher high. Comparison with the 2018 bear market bottom shows this exact behavior and its impact.
Comparing past Bitcoin bear market buy signals | Source: BTCUSD on TradingView.com Reversal Targets Retest Of $32,000 Support Turned ResistanceIf at all the bottom in Bitcoin is in, the next logical target would first be closing above the middle-Bollinger Band, and then pushing to the opposite side of the bands at roughly $32,000.
On the Ichimoku, the Kijun-sen is just about at the same level as the upper Bollinger Band, highlighting a clear level of importance on weekly timeframes. Much like the last bear market, Bitcoin has just taken the Tenkan-sen, and a cloud twist occurred after a bottom was already in.
Indicator dynamic resistance could give a target of $32K | Source: BTCUSD on TradingView.comRelated Reading: WATCH: Bitcoin, Wyckoff Theory, And The Composite Man | BTCUSD September 8, 2022
Could A 3-Month, 300% Rally Be In The Cards For Bitcoin?Since the condition from the 2018 bear market bottom appears so similar currently, let’s use the bars pattern to project the 2019 rally from where we are currently.
The result is a revisit to all-time highs. If you recall, the 2019 rally took only three months for BTC to gain 300%. It didn’t set a new high until almost another 18 months later.
The 2019 rally resulted in over 300% growth | Source: BTCUSD on TradingView.comLearn crypto technical analysis yourself with the NewsBTC Trading Course. Click here to access the free educational program.
Follow @TonySpilotroBTC on Twitter or join the TonyTradesBTC Telegram for exclusive daily market insights and technical analysis education. Please note: Content is educational and should not be considered investment advice.
Featured image from iStockPhoto, Charts from TradingView.comWhy this matters
This bitcoin story adds another data point to the current market tape and is useful when read alongside nearby source coverage.
Original source
Read on NewsBTCRelated market context
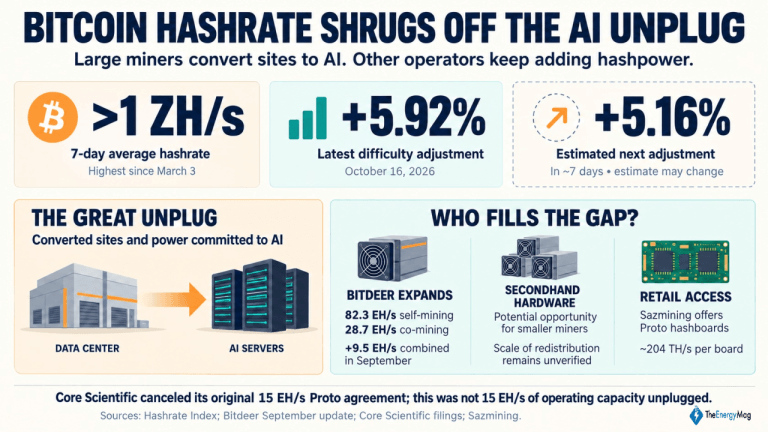
Miner Weekly: Bitcoin Hashrate Shrugs off the AI Unplug, Regaining 1 ZH/s Level
Big public miners are making room for artificial intelligence (AI). Bitcoin’s hashrate is climbing anyway. This article first appe...

Bitcoin (BTC) Price Prediction: $74K Liquidity Gap Puts $80K Support to the Test
Meanwhile, data from Glassnode and Fasanara Digital show that traditional financial assets are capturing a growing share of deriva...

PHP Flaw Shakes Internet, Bitcoin Flashes Bull Signal, and More – Weekly Recap
This week’s stories covered shifting market signals, DeFi expansion, institutional staking, venture capital and cybersecurity. Uni...
Bitcoin Hashrate Reclaims One Zettahash As Mining Competition Rebounds
TL;DR: BlocksBridge reported Bitcoin’s seven-day hashrate above one zettahash in the week to October 22. Mining competition has re...

McRib Is Back, and Bitcoin’s Weirdest Bullish Indicator Lives On
Crypto proponents are once again entertaining the curious connection between McDonald’s McRib and bitcoin prices, as the fast-food...

Kalshi and Polymarket hit record $2.7 billion in weekly crypto volume
The surge in crypto prediction market volume highlights a shift towards short-term speculative trading, impacting traditional trad...