WATCH: Daily Crypto Technical Analysis August 22, 2022: Bitcoin Price (BTCUSD)
Welcome to the first episode of NewsBTC’s all-new daily technical analysis videos. In the first episode, we are looking at Bitcoin price action using the weekly BTCUSD price chart. Specifically, this episode looks at Bit...
Archive context
Older archive item. Useful for background and entity history, but not a fresh market-moving signal.

Welcome to the first episode of NewsBTC’s all-new daily technical analysis videos. In the first episode, we are looking at Bitcoin price action using the weekly BTCUSD price chart.
Specifically, this episode looks at Bitcoin’s “most profitable buy signal” in its entire history: the hash ribbons. In addition, we analyze weekly momentum using the logarithmic MACD to try to understand if a bottom could be in. Take a look at the video below.
VIDEO: Bitcoin Price Analysis (BTCUSD): August 22, 2022All About The Hash Ribbons
The Hash Ribbons were created by Bitcoin analyst Charles Edwards. They are a pair of moving averages based on the Bitcoin hash rate and mining difficulty, and signal when miners are capitulating. When this phase ends, a buy signal is issued. In fact, its buy signal has been called Bitcoin’s most profitable buy signal, producing several thousand percent ROI on average each time it triggers. The signal is even more profitable when it appears prior to a Bitcoin halving
The hash ribbons have triggered a buy signal | Source: BTCUSD on TradingView.comWith the hash ribbons buy signal on the daily, weekly timeframes become more interesting in anticipation of a possible bottom. Although a bottom could be in already, the market has historically continued to draw down even after the hash ribbons buy signal.
Measuring Momentum With LMACDYesterday gave us a fresh weekly close in BTCUSD. In particular, we will be using the Logarithmic MACD in our analysis. The log version of the MACD provides better comparative analysis across past cycles.
Although the MACD had opened green the week prior, the late-week selloff uncrossed the bullish crossover and has forced momentum sideways. The weekly MACD is at historical bear market readings. Diverging down further would be unprecedented and likely take Bitcoin down below $17K.
Will momentum cross upward? | Source: BTCUSD on TradingView.comHowever, if bulls can complete the bull cross, in previous cycles the change in momentum was enough to kickstart a bullish impulse. The MACD is currently one of the most important indicators to watch on weekly timeframes. Although a bullish crossover could confirm the bottom, the MACD gets a reputation for being a lagging indicator and therefore the bottom could be in long before the bull crossover confirms.
The Ten Year Trend LineAdding credence to a potential bottom, Bitcoin weekly is sitting at a long-term trend line lasting over a decade long. The long term trend line has been touched on 5 separate occasions including the 2014 bear market bottom and Black Thursday in March 2020. Losing this trend line could be disastrous for the cryptocurrency market.
Will this nearly ten year long trend line hold? | Source: BTCUSD on TradingView.comLearn crypto technical analysis yourself with the NewsBTC Trading Course. Click here to access the free educational program.
Follow @TonySpilotroBTC on Twitter or join the TonyTradesBTC Telegram for exclusive daily market insights and technical analysis education. Please note: Content is educational and should not be considered investment advice.
Featured image from iStockPhoto, Charts from TradingView.comWhy this matters
This bitcoin story adds another data point to the current market tape and is useful when read alongside nearby source coverage.
Original source
Read on NewsBTCRelated market context
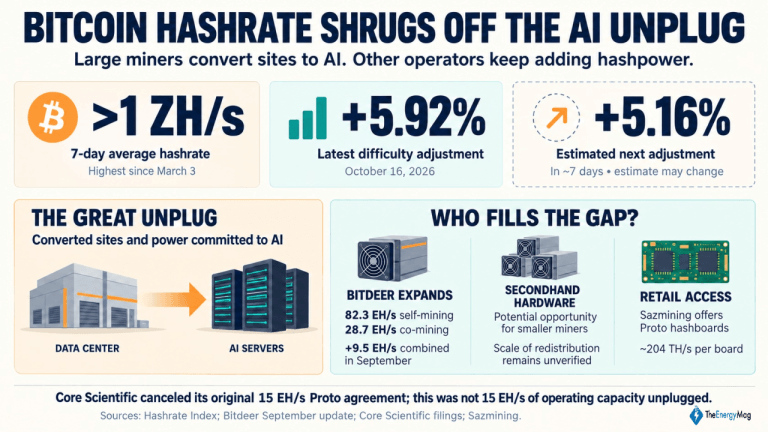
Miner Weekly: Bitcoin Hashrate Shrugs off the AI Unplug, Regaining 1 ZH/s Level
Big public miners are making room for artificial intelligence (AI). Bitcoin’s hashrate is climbing anyway. This article first appe...

PHP Flaw Shakes Internet, Bitcoin Flashes Bull Signal, and More – Weekly Recap
This week’s stories covered shifting market signals, DeFi expansion, institutional staking, venture capital and cybersecurity. Uni...

Bitcoin (BTC) Price Prediction: $74K Liquidity Gap Puts $80K Support to the Test
Meanwhile, data from Glassnode and Fasanara Digital show that traditional financial assets are capturing a growing share of deriva...
Bitcoin Hashrate Reclaims One Zettahash As Mining Competition Rebounds
TL;DR: BlocksBridge reported Bitcoin’s seven-day hashrate above one zettahash in the week to October 22. Mining competition has re...

Ethereum (ETH) Price Prediction: Whale Rotates $155M Into ETH as Longs Surge Near $2,500
Ethereum is trying to stabilize after another volatile stretch, with price returning toward the mid-$2,400 region while several po...

Pump.fun app passes Fomo in daily active traders on Solana
Pump.fun's rise highlights the volatility and competitiveness in Solana trading apps, emphasizing the importance of innovation and...