Why Bitcoin’s 63% HODL wave isn’t the mega bull signal everyone thinks it is
Bitcoin’s share of supply last moved at least one year ago reached 63.3% on Sept. 18, up 0.98 percentage points from 62.32% on Aug. 18, according to Maketo’s HODL-wave data. HODL waves group Bitcoin’s unspent transaction...
Archive context
Older archive item. Useful for background and entity history, but not a fresh market-moving signal.
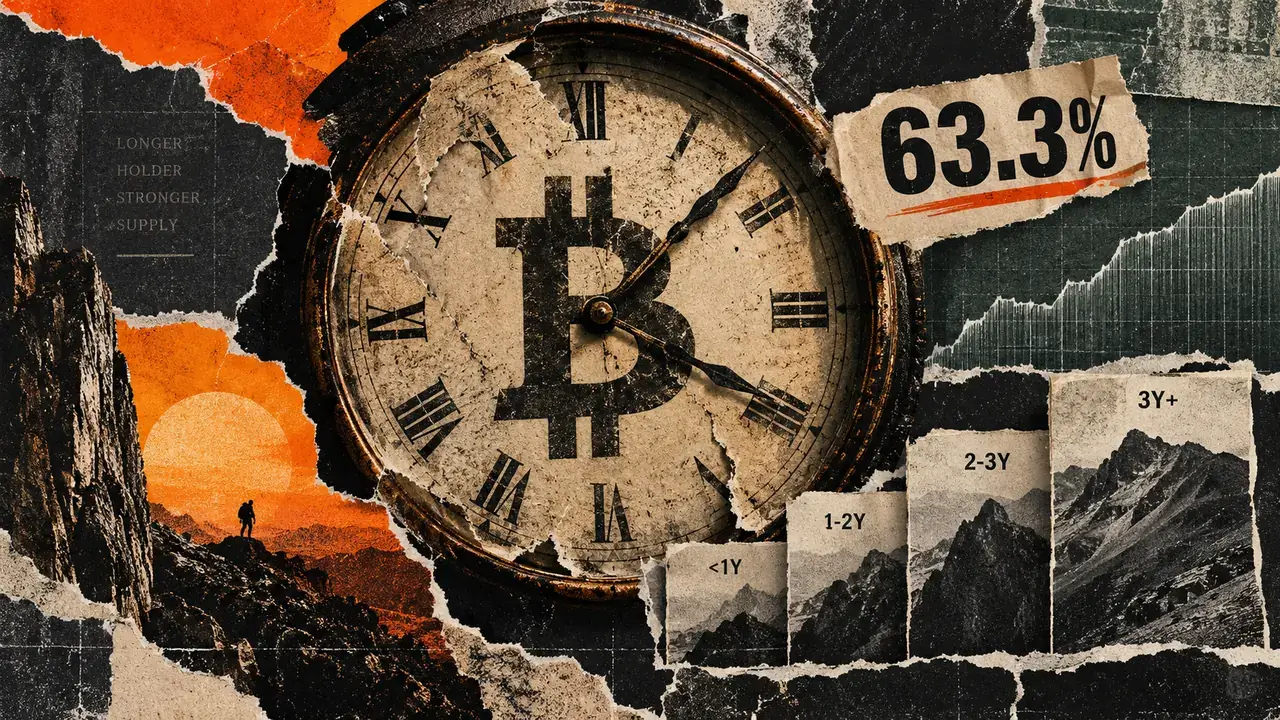
Bitcoin’s share of supply last moved at least one year ago reached 63.3% on Sept. 18, up 0.98 percentage points from 62.32% on Aug. 18, according to Maketo’s HODL-wave data.
HODL waves group Bitcoin’s unspent transaction outputs into age bands based on their last on-chain movement. The rising one-year share therefore shows that more supply now sits in older bands. Current-month buying and deliberate withdrawal from the market require separate evidence.
The underlying bands point to a specific mechanism. Coins that last moved roughly a year ago can enter the one-to-two-year bracket simply by remaining still long enough to cross the boundary.
Related Reading Over 61% of BTC hasn’t moved in a year: What it means for Bitcoin price What Bitcoin HODL waves measureThe one-to-two-year band increased to 14.57% of supply from 13.52% between Aug. 18 and Sept. 18, a gain of 1.05 percentage points. That was the largest positive change among the cohorts already older than one year.
Over the same period, the six-to-twelve-month band fell to 17.53% from 19.10%. Glassnode’s Sept. 18 snapshot showed the same latest values for both bands.
The paired moves are consistent with coins crossing the one-year boundary. Each band is a net share after coins age into it, age out of it or move on-chain and reset to the youngest cohort, leaving the identity and gross flow of the underlying units unresolved.
Infographic showing Bitcoin’s one-year HODL share rising from 62.32% to 63.3% as the six-to-twelve-month band shrank and the one-to-two-year band grew.Recent movement also eased. Coins last moved within one month accounted for 7.03% of supply on Sept. 18, down 0.27 percentage points from 7.30% a month earlier.
Related Reading Bitcoin’s old coins have gone quiet and $69,000 could reveal whether the new holders crackUnder Glassnode’s methodology, an unmoved output advances into older bands as it crosses each age threshold. Movement resets the clock.
Last-movement age leaves beneficial ownership and intent unresolved. A transfer between wallets controlled by the same person or custodian can make an output look young even when ownership has not changed. Lost coins can remain in the oldest bands without representing a deliberate decision to hold.
Coinbase provided a practical example in November 2025 when it warned that an internal wallet migration would create large on-chain volumes unrelated to market conditions. That episode illustrates attribution uncertainty and is not offered as the cause of the current shift.
Related Reading Coinbase’s $70B Bitcoin move made it look like investors were selling — but no one actually didThe Sept. 18 readings support a limited conclusion: Bitcoin’s on-chain age distribution grew older while the share moved within a month declined. Available-for-sale supply and liquid-supply tightening remain unmeasured.
Identifying a fresh-accumulation thesis needs corroboration from entity-adjusted balance changes, exchange flows, and spending behavior. Until those measures align, the rising one-year wave is an aging signal rather than proof of new demand.
The post Why Bitcoin’s 63% HODL wave isn’t the mega bull signal everyone thinks it is appeared first on CryptoSlate.
Why this matters
Bitcoin is a tracked market entity in the DigitalMoneyBox archive, making this useful context for readers monitoring repeated mentions and follow-up coverage.
Original source
Read on CryptoSlateRelated market context

Coinbase’s x402 Records 138.5M Transactions: Chainalysis Shows AI Agents Reshaping Crypto Payments
According to blockchain analytics firm Chainalysis, activity has expanded sharply since the protocol’s early stages, as autonomous...

Thailand crypto ETFs may see slow start despite new rules: CoinShares
Thailand’s new Bitcoin and Ether ETF rules take effect Friday, but CoinShares expects modest initial inflows as existing investmen...

SEC Crypto: What do the Coinbase and MARA Binary Options Mean?
In SEC crypto news, the commission has reportedly approved standardized binary options that pay a predetermined cash amount if a s...

VanEck Pulls Plug on Lido Staked ETH ETF After Yearlong Wait
VanEck Digital Assets asked the SEC last night, UK time, to withdraw the registration for its proposed Lido Staked Ethereum ETF, n...
Binance Claims Fastest $1 Billion Sprint in bStocks With $6 Billion in Share Conversions
Binance has reported that its bStocks product crossed $1 billion in assets faster than any competing tokenised equity offering. Un...

Ripple and Privy Bring XRP Wallets to XRPL After $1T Moved Across 8M Accounts
Key Takeaways: With the collaboration of Ripple, Privy offers programmable wallet infrastructure to the XRP Ledger. Developers can...