Analyst: VeChain Enters Buy Zone, Should You Jump In?
On the weekly timeframe, a crypto analyst named Egrag explained on Twitter that VeChain (VET) is currently in a buy zone. He further explained the details of its possible price behavior using trading charts and noting re...
Archive context
Older archive item. Useful for background and entity history, but not a fresh market-moving signal.

On the weekly timeframe, a crypto analyst named Egrag explained on Twitter that VeChain (VET) is currently in a buy zone. He further explained the details of its possible price behavior using trading charts and noting recurring patterns.
VET is in the green today, holding onto its gains from yesterday’s closing price.
Egrag’s Analysis on VeChain (VET)Egrag mentioned VET’s attempt to exit the descending channel and move into an uptrend in his analysis. The asset has remained in a descending channel since it fell below its all-time high value of $0.2782 in April 2021. According to Egrag, VET attempted a breakout from this descending channel five times previously.
He noted that the more VET attempts, the closer it will break upwards from its current channel. Also, the analyst stated that VET would likely form a double bottom. A double bottom is a technical chart pattern where the price of an asset touches a low point twice, with a slight recovery in between.
A double bottom is often associated with a trend reversal, accompanied by a potential break to the upside for an asset.
The analyst believes this pattern could occur at the $0.015 price level or the $0.007 zone if the asset’s price declines further. Historical data shows that the last time VET reached this price level was in June 2020.
Egrag set up three targets for the asset as pivot points to exit the descending channel. His price targets are $0.0648, $0.11649, and $1.66. He believes that VET will repeat its past price action in 2018 as it remained in a descending channel until it broke out in 2020.
This breakout climaxed in its all-time high value of $0.2782 on April 17, 2021. In conclusion, the analyst stated that VET is currently in a buy zone which presents traders with an attractive buy opportunity.
VET’s weekly chart shows that the buy zone is between $0.012 and $0.025. The asset entered this zone in December 2022 and traded there until January 2023.
Analyzing VET’s Price ActionVET is currently in a sideways trend on the weekly chart, but if the analysis is right, the token might see some action in the short term.
VET’s sideways trend from December 2022 ushered in an uptrend in March 2023. Therefore, the token’s price current sideway trend will likely break upward in the coming weeks if history repeats itself and VET can break from the descending channel.
The Relative Strength Index (RSI) is 41.89 in the neutral zone, reflecting the trend on the weekly chart. However, it will move to the upside if the bulls prevail. But VET is trading below its 50-day and 200-day Simple Moving Averages (SMA), a bearish signal for the asset.
Combined with the descending channel and price consolidation, this fact could hint at a fresh decline. If VET cannot target and reach higher levels, bears could re-take control and send the token back into critical support.
VET is currently trading at the $0.01943 price level and may increase to $0.06 in the coming weeks as it recovers.
Featured image from Pexels, chart from TradingView
Why this matters
This cryptocurrency story adds another data point to the current market tape and is useful when read alongside nearby source coverage.
Original source
Read on NewsBTCRelated market context

Strategy dips on bad MSCI World Index news
Strategy’s stock price dipped 4% in after-hours trading yesterday as traders speculated about its removal from the MSCI World Inde...

Hot Inflation Data Puts Bitcoin Under Pressure, but ‘Difficult’ Isn’t ‘Bearish’: CoinShares
Bitcoin Magazine Hot Inflation Data Puts Bitcoin Under Pressure, but ‘Difficult’ Isn’t ‘Bearish’: CoinShares Bitcoin’s price has d...
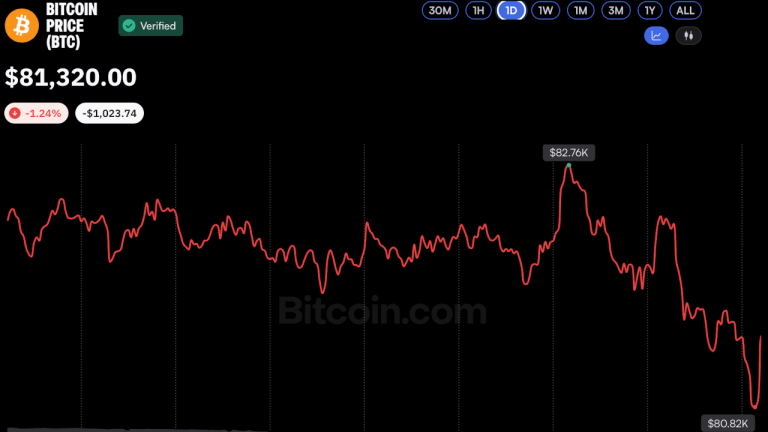
Bitcoin Price Hovers Near $81K as Analysts See Potential Market Bottom
Bitcoin slipped below $81,000 on Oct. 16 amid heightened market volatility, but analysts remained cautiously optimistic, suggestin...

Ethereum Price Prediction: ETH Outpaces the Market as Crypto Rebounds
Ethereum is outperforming the crypto market, rising by almost 3% over the past 24 hours to just a notch under $2,500 as digital as...

Bitcoin Price Prediction: Bitcoin Tracks Treasury Real Rates, Fidelity Finds
Bitcoin is trading at $82,000, rebounding from $80,000 since yesterday morning, as traders weigh a new macro signal that could fli...

Claude AI Predicts that Chainlink (LINK) Could Hit Triple Digits in 2026
Claude AI predicts a wildly bullish price target for Chainlink (LINK), claiming it could reach $100 by January 1, 2027, if a near-...